Do sneakers still resell above retail? 3,770 releases by brand, and how it changed through 2025
Half of new releases sell at or below retail. Only a third sell high enough to cover the fees.
A common assumption about sneaker resale is that new releases sell for more than they cost at retail. For the typical release, recorded sales say otherwise. We took 3,770 sneaker releases that launched between October 24, 2024 and December 31, 2025 and compared each one's median StockX sale in the 90 days after release with the retail price StockX lists for it. Across 1,729,436 sales, the typical release sold for exactly its retail price (median premium +0.0%, 95% interval -1.4% to +0.7%).
- 48.7% of releases resold above retail (95% interval 47.1-50.3%).
- 34.4% resold at least 13.6% above retail. That is roughly what a StockX Level 1 seller needs to get retail back after the 9% transaction fee and 3% payment processing, before shipping.
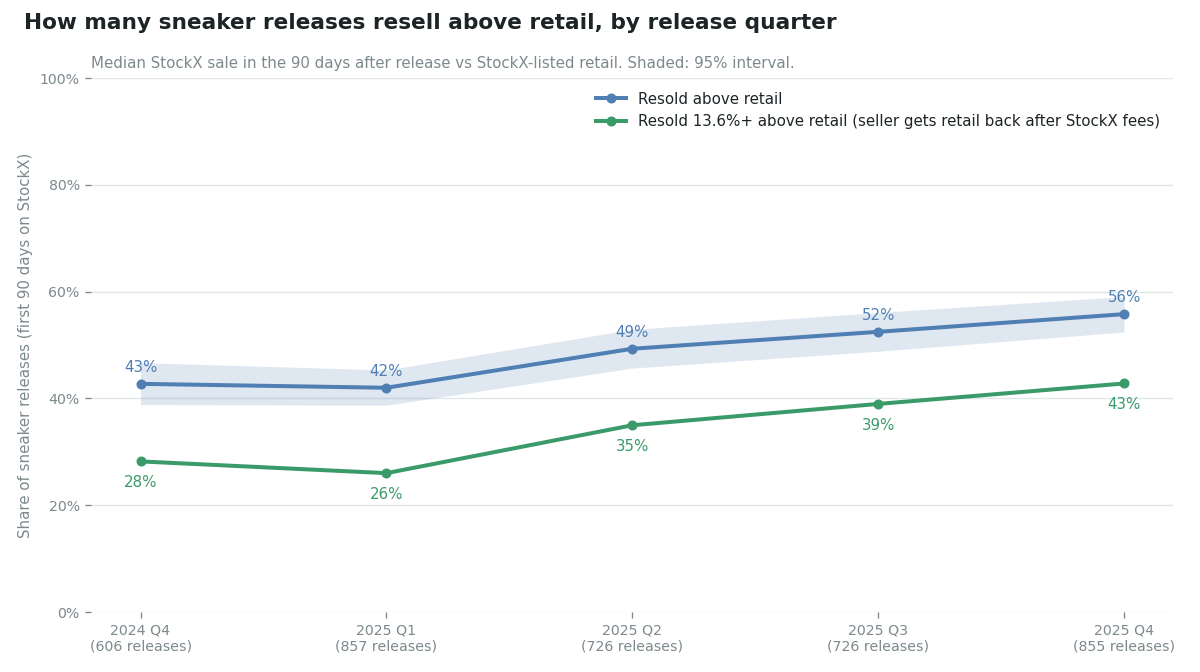
- The share rose through 2025, from 43% of releases in late 2024 to 56% in Q4 2025.
Sneakers are the weakest category for beating retail
| Category | Releases | Resold above retail | Cleared fees (+13.6%) | Median vs retail |
|---|---|---|---|---|
| Streetwear | 1,943 | 93.5% | 87.0% | +42.9% |
| Handbags | 124 | 88.7% | 71.8% | +31.2% |
| Collectibles | 753 | 80.2% | 73.0% | +39.3% |
| Sneakers | 3,770 | 48.7% | 34.4% | +0.0% |
Sneakers are the only category here where more than half of releases sold at or below retail. In every other category, at least four in five releases beat retail.
By brand: the big two sit at the bottom
| Brand | Releases | Above retail | 95% interval | Cleared fees | Median vs retail |
|---|---|---|---|---|---|
| Nike | 1,495 | 43.3% | 40.8-45.8% | 29.5% | -4.3% |
| Air Jordan | 528 | 32.6% | 28.7-36.7% | 18.9% | -11.7% |
| adidas | 520 | 52.9% | 48.6-57.1% | 35.2% | +2.8% |
| New Balance | 330 | 50.0% | 44.6-55.4% | 33.3% | +0.5% |
| ASICS | 216 | 51.4% | 44.8-58.0% | 38.0% | +2.8% |
| Puma | 100 | 65.0% | 55.3-73.6% | 49.0% | +13.0% |
| Crocs | 92 | 84.8% | 76.1-90.7% | 72.8% | +33.3% |
| UGG | 65 | 76.9% | 65.4-85.5% | 69.2% | +25.5% |
| Converse | 49 | 79.6% | 66.4-88.5% | 69.4% | +35.7% |
| Vans | 34 | 97.1% | 85.1-99.5% | 97.1% | +57.2% |
Air Jordan releases had the lowest hit rate of any major brand. Only one in three resold above retail, and the median Jordan release sold 11.7% under it. Nike was next at 43%. Nike put out far more qualifying releases than any other brand, and the brands with smaller release counts (Crocs, UGG, Converse, Vans) cleared retail most often. The smaller brands' numbers rest on fewer releases, which is why their intervals are wider. Many of those releases are limited runs: most of the 34 Vans releases are Old Skool 36 variants or collaborations such as Gallery Dept. and WTAPS.
Price point matters too. Releases under $100 retail resold above retail 72.1% of the time. For $150-199 releases it was 39.9%, the lowest of any price band. Above $300 it rose again to 60.3%.
Over time: more releases cleared retail as 2025 went on
| Release quarter | Releases | Above retail | 95% interval | Cleared fees | Median vs retail |
|---|---|---|---|---|---|
| Q4 2024 (from Oct 24) | 606 | 42.7% | 38.9-46.7% | 28.2% | -4.7% |
| Q1 2025 | 857 | 42.0% | 38.7-45.3% | 26.0% | -5.2% |
| Q2 2025 | 726 | 49.3% | 45.7-52.9% | 35.0% | +0.0% |
| Q3 2025 | 726 | 52.5% | 48.8-56.1% | 39.0% | +3.9% |
| Q4 2025 | 855 | 55.8% | 52.4-59.1% | 42.8% | +5.7% |
Comparing releases from the second half of 2025 with those from October 2024 to June 2025, the share above retail rose from 44.6% to 54.3% (two-proportion test, p < 0.0001). The median release went from 3.3% under retail to 5.0% over.
Two things could fake a rise like this, so we checked both. The first is holiday demand. It does not explain the rise: the Q4 2024 releases also had a holiday selling window and came in at 42.7%. The second is brand mix. If more releases in late 2025 came from brands that usually beat retail, the overall share would rise without any brand changing. So we compared each brand with itself (Benjamini-Hochberg corrected across the seven brands with enough releases):
| Brand | Oct 2024-Jun 2025 | Jul-Dec 2025 | q |
|---|---|---|---|
| Nike | 37.6% of 889 | 51.7% of 606 | < 0.001 |
| Air Jordan | 28.2% of 291 | 38.0% of 237 | 0.03 |
| Puma | 56.7% of 67 | 81.8% of 33 | 0.03 |
| Crocs | 74.4% of 39 | 92.5% of 53 | 0.03 |
| New Balance | 54.2% of 201 | 43.4% of 129 | 0.08 (not significant) |
| adidas | 53.0% of 300 | 52.7% of 220 | 0.95 |
| ASICS | 51.9% of 133 | 50.6% of 83 | 0.95 |
The rise was concentrated in Nike and Jordan. Nike releases went from 38% to 52% above retail, and Jordan from 28% to 38%, still the lowest of the major brands. adidas and ASICS did not change. New Balance slipped, though not by enough to rule out chance.
The biggest multiples
| Release | Released | Retail | 90-day median | Sales |
|---|---|---|---|---|
| Jordan 1 Low OG SP Fragment x Travis Scott Sail Military Blue | Nov 15, 2025 | $155 | $1,298 | 3,730 |
| NikeCraft Mars Yard 3.0 Tom Sachs Space Camp | Sep 19, 2025 | $275 | $1,473.50 | 1,278 |
| adidas F50 Elite Laceless FG Lamine Yamal | Dec 18, 2024 | $200 | $743 | 123 |
| Crocs Classic Clog The Twilight Saga | Nov 18, 2025 | $75 | $272.50 | 100 |
| Nike Air Max 95 SP Undefeated Geo NYC Neon | Dec 11, 2025 | $200 | $700 | 124 |
| Nike SB Dunk Low Supreme 94 Camper Green | Sep 4, 2025 | $135 | $457 | 413 |
These are the exceptions, and almost all are collaborations or signature pairs. Before listing a pair, the resale fee calculator shows what you would take home after fees, and StockX or GOAT? shows which platform has paid more for that shoe recently. Brand-level detail is on the Nike and Air Jordan pages.
None of this is a forecast. It describes how past releases sold, not how the next one will.
How we measured this
Methodology: StockX sales recorded via kicks.dev. Retail price and release date are StockX's own listing fields. A release is a StockX product with a listed retail price ($20-$2,000) and a release date from October 24, 2024 (when our StockX sales records start) to December 31, 2025. Its resale price is the median StockX sale in the 90 days from the release date (sales $10-$5,000), and it needs 20+ sales in that window, the same bar for every quarter. Releases that barely resell never reach 20 sales and are left out, so the true share of all releases selling above retail is probably lower than shown. Our StockX catalog was last loaded in February 2026, so 2026 releases are incomplete and excluded. 95% intervals are Wilson intervals for shares and bootstrap intervals for medians. Brand comparisons use two-proportion tests with Benjamini-Hochberg correction across the seven brands. "Cleared fees" assumes StockX Level 1 (9% + 3%) and ignores shipping. Category is StockX's product type.