Do StockX and GOAT prices move together? Barely week to week, strongly over a year
For the same shoe, one week's price change on StockX says little about GOAT. Stretch the window to three months and the two markets agree most of the time. Over a year they move together 89% of the time.
GOAT and StockX sell the same sneakers to the same kind of buyer. So when a shoe gets more expensive on one, you'd expect it to get more expensive on the other. Resellers often check one site and assume the other matches.
We tested it on 4,303 shoes sold on both sites, matched by style code, over two years of sales.
The answer depends on how long you look. Week to week, the two prices barely move together. Over three months they mostly agree, and over a year they move together strongly: when a shoe's price moved 5% or more on both sites, it went the same way 89% of the time.
Week to week, it's mostly noise
We compared changes, not price levels. For each shoe and each week, we asked: did its median price go up or down on StockX, and did it go up or down on GOAT?
With every shoe that had at least 3 sales a week on each site, the correlation is just 0.03 (95% range 0.03 to 0.04). When both prices moved at least 2%, they moved the same way 54% of the time, barely better than a coin flip.
That's not because the markets are unrelated. A weekly median from a handful of sales jumps around with which sizes happened to sell. Limit it to shoe-weeks with 20 or more sales on each site and the correlation rises to 0.19, with the same direction 69% of the time. Better, but still a weak weekly signal.
One week's price on one site tells you little about the other. A quarter's trend tells you a lot.
Over longer windows, the markets agree
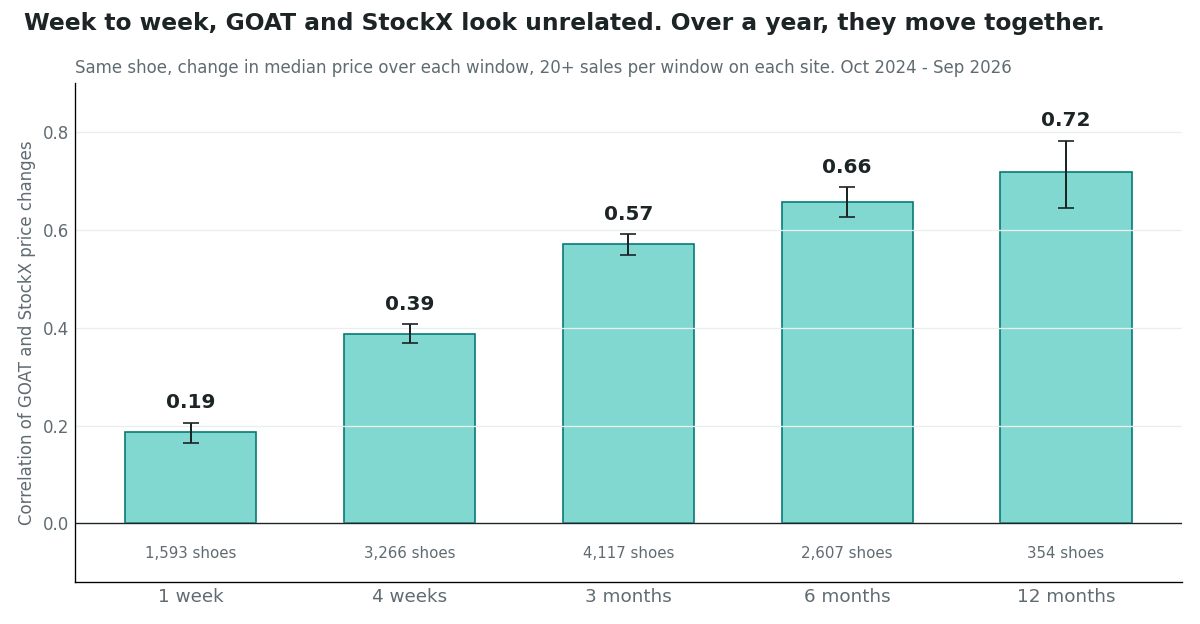
Here's the same test with the price change measured over longer windows, always with 20+ sales per window on each site:
| Window | Correlation (95% range) | Same direction when both moved 5%+ | Shoes |
|---|---|---|---|
| 1 week | 0.19 (0.16 to 0.21) | 69% | 1,593 |
| 4 weeks | 0.39 (0.37 to 0.41) | 77% | 3,266 |
| 3 months | 0.57 (0.55 to 0.59) | 84% | 4,117 |
| 6 months | 0.66 (0.63 to 0.69) | 87% | 2,607 |
| 12 months | 0.72 (0.64 to 0.78) | 89% | 354 |
A correlation of 0.72 is strong for market data. Both sites are pricing the same underlying demand. The weekly differences come from who happens to be buying and selling that week, and they wash out.
Neither site leads
If one marketplace set the price and the other followed, you'd see one site's moves show up on the other a week later. They don't, in either direction. GOAT one week ahead of StockX correlates at 0.02, and StockX ahead of GOAT at 0.02. Both are real in a statistical sense with this many shoes, but far too small to trade on.
The same shoe often sells at a different price
Moving together isn't the same as matching. Over the last 90 days, for 4,148 shoes with 10+ sales on each site, the typical shoe's median was only 1.1% higher on GOAT, and GOAT was the higher of the two for 53% of them. But 47% differed by 10% or more one way or the other.
Some of that is size mix: if one site sold more of the pricier sizes, its median runs higher. Some is how each site records a sale. Either way, for any single pair the gap can be real money, especially after each site's seller fees.
What this means for buyers and sellers
- Don't read one site's week as the market's week. A single week's move on StockX or GOAT is mostly noise.
- Trust the trend. If a shoe has been climbing or sliding for a few months on one site, the other has very likely done the same.
- Check both before you sell. The trend matches, but the price on the day often doesn't. Our where to sell tool compares the two by size.
For a case where the two markets clearly did split, read how StockX's fee-free days changed sales and prices.
How we measured this
Methodology: Completed GOAT and StockX footwear sales recorded by SneakerPulse, October 7, 2024 to September 13, 2026, at $20 to $30,000. Shoes matched across the two sites by style code (letters and digits only, 6+ characters). Weekly test: each shoe's weekly median price on each site in weeks with 3+ sales on both, week-over-week log changes for consecutive weeks, shoes with 8+ such weeks (4,303 shoes, 147,996 shoe-weeks); each shoe's changes demeaned, then pooled. 95% ranges by bootstrap over shoes; p-values by shuffling which StockX series goes with which GOAT series (500 shuffles), Benjamini-Hochberg across the three lead/lag tests (all q < 0.01). Longer windows: non-overlapping blocks of 1, 4 or 13 weeks, each block's price the sales-weighted geometric mean of its weekly medians, 20+ sales per block on each site; changes between consecutive blocks (6 and 12 months: blocks 2 and 4 apart). Weeks overlapping May 22 to July 3, 2026, when our StockX source is missing most best sellers, are dropped. "Same direction" counts pairs where both sites moved 5% or more (2% for the first weekly figure), with 95% Wilson intervals within 2 points either way except 12 months (85% to 92%). Price gap: last 90 days, shoes with 10+ sales on each site, GOAT median over StockX median. Prices are as each site records them. Past data, not a forecast, and not buying or selling advice.