Do tax refunds fuel sneaker resale? Two filing seasons say no
The IRS sent out more than $70 billion in a single February week in both 2025 and 2026. Sneaker resale didn't jump either time, and the bigger refund season came with the quieter spring.
Every February, resellers repeat the same line: refunds are coming, so hold your pairs and list them in March. It makes sense on paper. The IRS pays out most of the year's individual refunds in a few weeks, and some of that money has to land somewhere.
So we checked. We lined up every weekly IRS refund report for the 2025 and 2026 filing seasons against footwear sales on GOAT and StockX, week by week.
The short answer: refund money doesn't show up in sneaker resale. The biggest refund week of each year did nothing consistent to sales. And 2026, which paid out more, had the weaker spring.
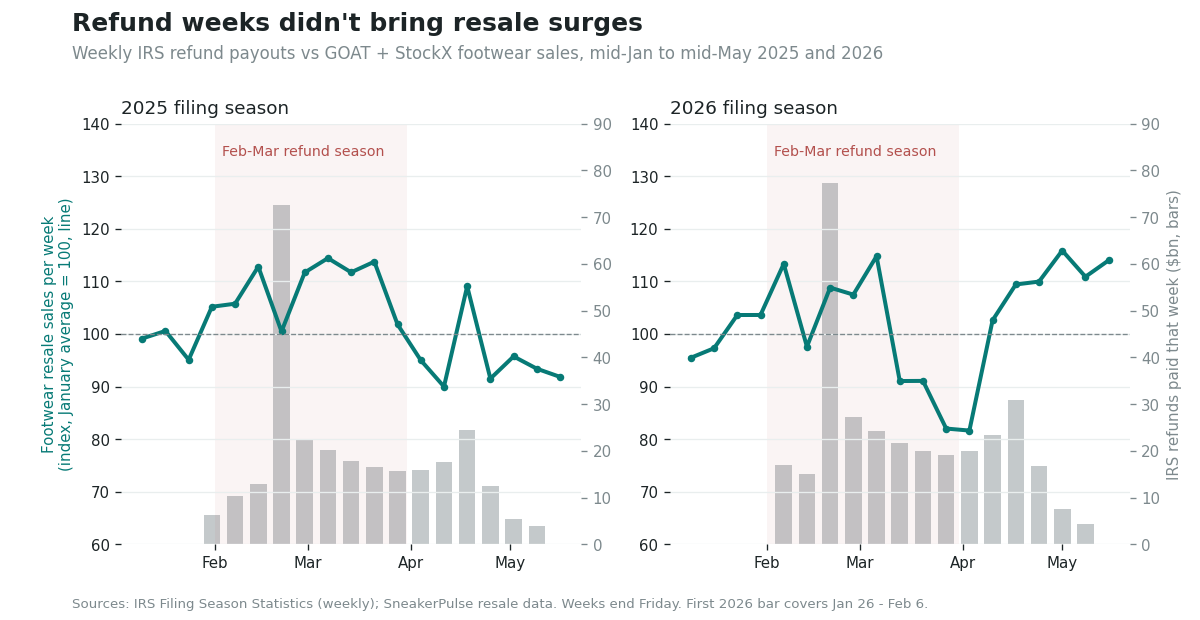
The biggest refund week moved nothing consistently
Each year has one natural test. By law the IRS holds refunds that claim the Earned Income Tax Credit or the Additional Child Tax Credit until mid-February, then releases them all at once. That week's payouts were more than five times the week before in both years.
| IRS week ending | Refunds paid that week | Footwear resale sales | Same shoes: sales | Same shoes: price |
|---|---|---|---|---|
| Feb 21, 2025 | $72.6bn | -10.9% | -4.5% | -0.9% |
| Feb 28, 2025 | $22.6bn | +11.2% | +10.6% | -0.2% |
| Feb 20, 2026 | $77.2bn | +11.5% | +5.0% | -1.6% |
| Feb 27, 2026 | $27.3bn | -1.2% | +6.8% | +0.8% |
Changes are vs the week before.
In 2025 resale fell the week refunds peaked. In 2026 it rose. That's the week-to-week noise of the resale market, not a refund effect.
Across all 26 week-to-week changes in both seasons, the size of the change in refunds had no link to the change in total footwear resale (correlation +0.05, 95% range -0.37 to +0.45) or to the same shoes' sales (-0.01, -0.40 to +0.38). Waiting a week didn't help: the week-later correlations were +0.05 and +0.19, both ranges crossing zero.
The IRS put more than $70 billion into bank accounts in one week, twice, and the sneaker market didn't notice.
Prices dipped slightly in refund-heavy weeks
One result did hold up. In weeks when refunds grew, the same shoes sold for slightly less (correlation -0.62, 95% range -0.82 to -0.26). It passes the correction for testing 17 things at once (q = 0.02, where anything under 0.05 is unlikely to be chance), and it holds with ranks instead of raw values (-0.55) and without the two mid-February release weeks (-0.56).
The size is small. Doubling a week's refunds went with about 0.5% lower same-shoe prices, and the largest drop in either of those weeks was 1.6%. It is also the opposite of "refunds fuel resale." And with only two seasons that follow the same IRS calendar, we can't tell a refund effect apart from something else that happens at the same point every spring.
The bigger refund year had the quieter spring
The strongest test compares the two years. By the last IRS report of March, 2026 had paid out $221.7 billion in refunds against $195.2 billion at the same point in 2025, $26.5 billion (13.6%) more. If refunds drive resale, 2026's February and March should have been stronger relative to the weeks around them.
They weren't. In 2025, February-March weeks were 12.5% busier than January and April-May (95% range +6.6% to +18.8%). In 2026 they were 3.3% quieter (range -24.7% to +24.2%). The gap between the years, -14.1% (range -28.8% to +3.6%), points the wrong way for the theory, though with two seasons it isn't statistically significant (q = 0.32).
The same-shoe versions agree. Same-shoe sales were 11.4% higher in 2025's refund weeks and 7.2% lower in 2026's, neither clearly different from zero. Same-shoe prices barely moved in either year (-0.4% and -0.7%).
What this means for buyers and sellers
Refund season is real money, but over the last two years it hasn't changed how many sneakers resell or what they sell for in any way we could detect. Whatever moved resale from week to week in these two springs, it wasn't the refund calendar.
Two seasons is a small sample, so a modest refund effect could still be hiding in the noise. What the data rules out is a big, reliable one. For the seasonal patterns we can measure, see seasonality on the dashboard and our best time to sell tool. For another popular theory that didn't hold up, read Do NBA stars' big games sell their sneakers?
How we measured this
Methodology: Refunds come from the IRS's weekly Filing Season Statistics pages on irs.gov (index: irs.gov/newsroom/filing-season-statistics-by-year), 15 weekly reports for 2025 (week ending Jan 31 to May 9) and 14 for 2026 (Feb 6 to May 8). We differenced the cumulative "total amount refunded" into weekly dollars. Three early 2025 pages don't give a dollar total: for Feb 7 and Feb 14 we used the 2025 column printed on the matching 2026 pages (refund counts match exactly); for Jan 31 we multiplied the refund count by the average refund. The first 2026 report covers Jan 26 to Feb 6, so it's left out of the week-to-week tests. Resale: completed GOAT and StockX footwear sales, grouped into the IRS's Saturday-to-Friday weeks, from the first full week of combined coverage in mid-January to mid-May of each year. We never compare raw volume across time, because our product coverage grows. Measures: week-over-week log change in total footwear sales, and, for shoes with 5+ sales in both weeks, the 10%-trimmed mean log change in each shoe's weekly sales and median price (medians were mostly exactly zero). Tests: correlations of the week-over-week log change in refund dollars with each measure, same week and one week later, with both seasons pooled and p-values and 95% ranges from an effective sample size that accounts for autocorrelation. Season lift: average log level in weeks ending in February-March minus the surrounding weeks within each year (same-shoe measures chained into an index), with standard errors widened for week-to-week autocorrelation, plus the 2026-minus-2025 difference. Benjamini-Hochberg correction across all 17 tests. Limits: two seasons of 14 and 12 weekly changes, the same calendar in both years (refund timing can't be separated from other spring patterns), national totals only, and no way to tell who received a refund or who bought. The windows end before our StockX data gap (May 22 to July 3, 2026). Past data, not a forecast, and not buying or selling advice.