Holiday planning for sneaker resale stores: when demand peaks and when to buy
Last holiday season, four weeks from Black Friday to December 21 did the business of eight normal weeks, and January fell below normal. Prices hardly moved. For a resale store, the holiday is about having the pairs in stock, and the buying happens in October and November.
If you run a sneaker resale store, the fourth quarter decides your year. The usual way to plan it is gut feel: stock up "for the holidays", hope the boots arrive before the cold, and mark down whatever is left in January.
We looked at how last season actually played out, week by week, for the same 14,214 sneakers across 3.5 million GOAT and StockX sales. From the week of Black Friday to December 21, those four weeks sold as much as eight normal weeks. Then January ran about 15% below normal. Prices barely moved through any of it.
So the holiday is a question of stock, not of price. A store that buys in December is buying for the season after the one it needs.
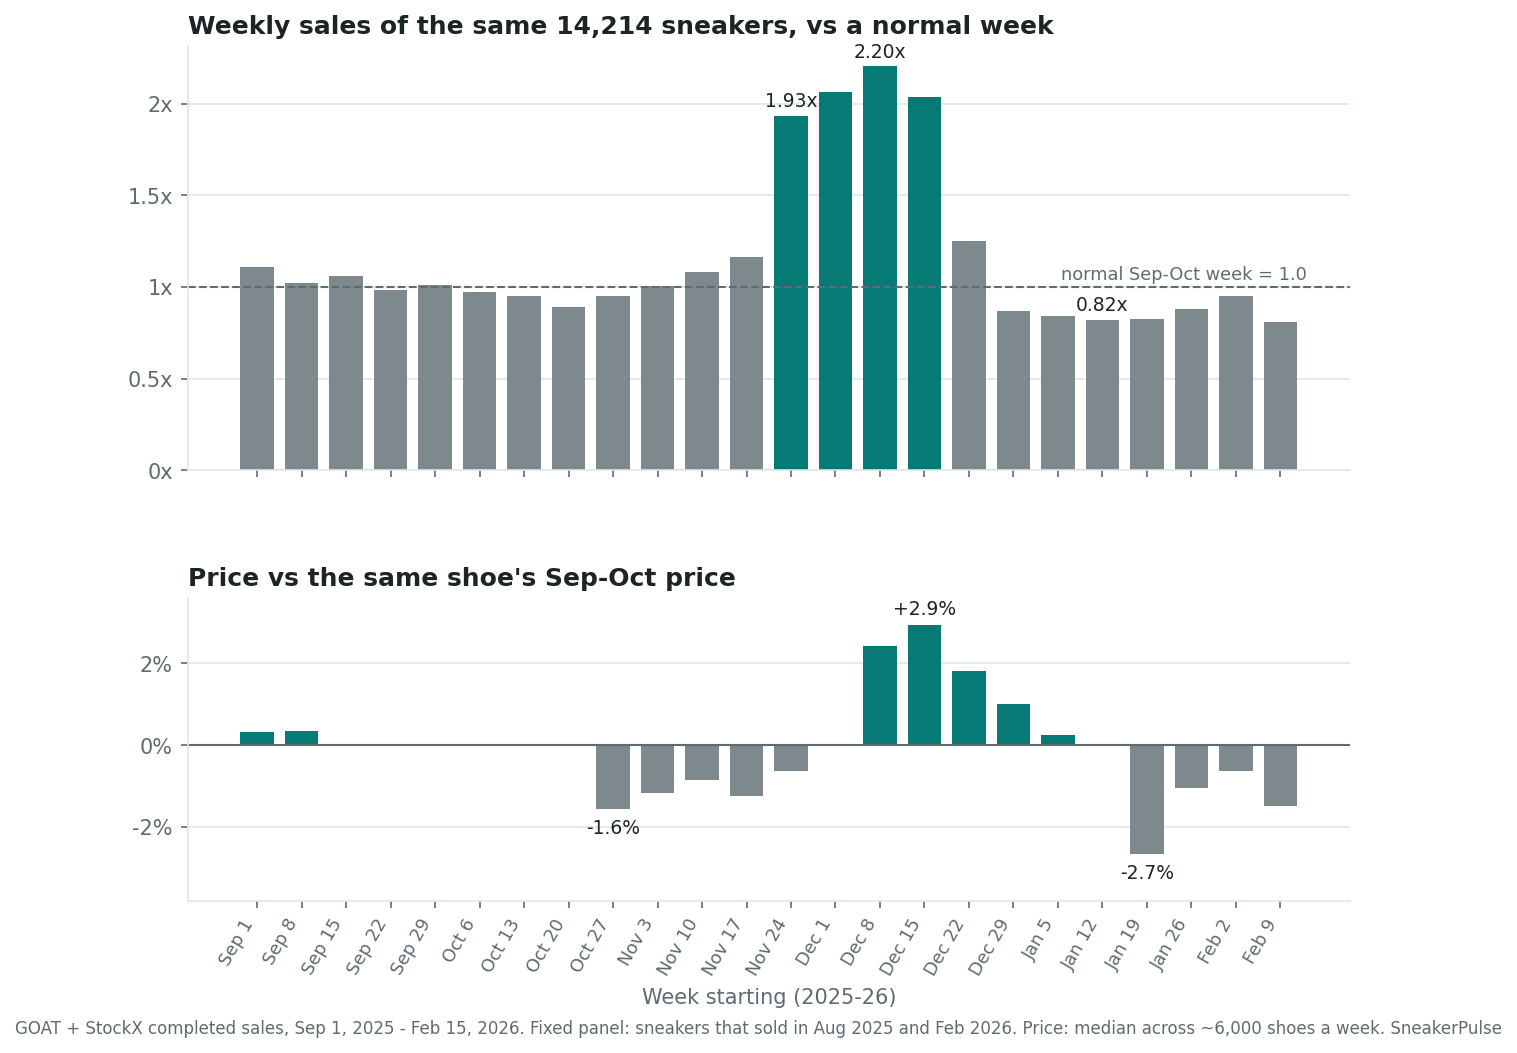
The season is four weeks long, and it starts on Black Friday
October looked like September. The same shoes sold at 0.94 times a normal week across the month. November built slowly, to 1.08 and then 1.16 in the two weeks before Thanksgiving.
Then it jumped. Black Friday week ran at 1.93 times normal, and the three weeks after it at 2.06, 2.20 and 2.04. The peak was the week of December 8, not Black Friday itself. After December 21 the drop is as sharp as the rise: 1.25 in Christmas week, 0.87 over New Year, and 0.82 to 0.88 every week through January.
Four weeks did the work of eight. Every pair that is not in stock by the first week of December misses most of the season.
Prices do not pay for the peak
It would be natural to expect holiday prices to jump with demand. They barely moved. Against each shoe's own September-October price, the typical shoe sold for 0.6% to 1.6% less from late October through November. That dip showed up in every one of those five weeks, and is significant after correcting for testing 24 weeks.
Prices rose only in December: +2.4% the week of December 8 and +2.9% the week of December 15, the high point. The low came in the week of January 19, at 2.7% below the fall price. That is the market clearing its leftover holiday stock.
For planning, that means the margin case for holding stock into December is small, about 3 points. The volume case is twice normal sales. The risk sits in January, when volume drops below normal and prices slip at the same time.
Each category runs on its own calendar
Grouping the same panel by category shows why one holiday plan for the whole store falls short.
| Category | Shoes | Oct | Nov | Dec | Jan | Peak week |
|---|---|---|---|---|---|---|
| Boots & UGG | 271 | 1.35x | 2.43x | 4.28x | 2.09x | Dec 15 (5.60x) |
| Slides & clogs | 371 | 0.92x | 1.43x | 1.99x | 0.71x | Dec 8 (2.98x) |
| Running & retro runners | 1,887 | 0.95x | 1.32x | 1.94x | 0.89x | Dec 8 (2.62x) |
| Jordan | 3,091 | 0.90x | 1.31x | 1.70x | 0.75x | Dec 8 (2.23x) |
| Other sneakers | 8,594 | 0.95x | 1.22x | 1.46x | 0.85x | Dec 8 (1.86x) |
Average weekly sales in each month vs the same shoes' normal September-October week.
Boots and UGGs are the only category already above normal in October, at 1.35 times. They reach more than four times normal in December and still run twice normal in January, when everything else is below it. That is the one category where a January stock position is not a problem. Slides and clogs, many of them bought as gifts, swing hardest the other way: nearly double in December, then 0.71 times normal in January. Jordans fall almost as far, to 0.75.
Our boots and cold weather and UGG by month posts go deeper on that category.
Turning the curve into an open-to-buy
This is where a demand curve becomes a buying plan. Open-to-buy is the amount of new stock you can receive in a month without overshooting the inventory you planned to hold:
Receipts = planned sales + planned end-of-month inventory - beginning-of-month inventory
Here is the arithmetic for an illustrative store. It sells $20,000 a week in a normal September-October week, applies last season's curve to that, and aims to start each month with six weeks of that month's expected sales in stock. The store is invented; the monthly indexes are last season's.
| Month | Weeks | Sales vs normal | Planned sales | Stock at start | Stock at end | Receipts to plan |
|---|---|---|---|---|---|---|
| October | 4 | 0.94x | $75,400 | $113,100 | $155,700 | $118,000 |
| November | 4 | 1.30x | $103,800 | $155,700 | $202,300 | $150,400 |
| December | 5 | 1.69x | $168,600 | $202,300 | $101,200 | $67,500 |
| January | 4 | 0.84x | $67,500 | $101,200 | $105,800 | $72,100 |
The buying peak lands a month before the selling peak. November needs $150,400 of receipts to cover $103,800 of sales, because it is building the stock December will sell. December sells the most, $168,600, but needs the least new stock of the four months. A store that plans receipts to match each month's sales ends up buying most heavily in December, just as demand turns, and carries that stock into a January that runs below normal with prices falling.
What this means for this year
This is last season's pattern, not a forecast. The calendar shifts a little each year, and big holiday releases add demand on top (brand-new shoes are outside this panel by design). But the shape was consistent across the whole panel and across every category except boots:
- October is a normal month. It is the time to buy.
- Stock should be in place by the week of Black Friday. The four weeks that follow are half the quarter.
- Price does not reward late stock. December prices ran only about 3% above fall prices.
- January is the risk month, except for boots.
To see what a particular shoe sells for right now, use the price checker. The best time to sell tool compares each shoe with itself across the whole year. Our inventory planning guide and size curve posts cover the other two planning questions: which sizes to buy, and how fast new releases sell through.
How we measured this
Methodology: GOAT and StockX completed sales recorded by SneakerPulse, weeks starting September 1, 2025 through February 9, 2026 (ending February 15). Fixed panel: footwear with at least 3 sales in August 2025 and at least 3 in February 1-15, 2026 (14,214 shoes, 3,486,186 sales; apparel, collectibles and cleats excluded). Holding the product list fixed means shoes added to our feed during the season, and new releases, cannot inflate the curve. The weekly index is each week's panel sales divided by the average week from September 1 to October 26, 2025. Monthly figures average the weeks that start in that month. Price: for each of about 6,000 shoes a week (shoes with 20+ sales in September-October and 3+ that week), the week's median price divided by that shoe's September-October median. The chart shows the median of that ratio across shoes, with 95% bootstrap intervals (week of Dec 15 +2.9% [+2.5, +3.3], week of Jan 19 -2.7% [-3.2, -2.1], week of Oct 27 -1.6% [-1.9, -1.2]). Each week was tested with an exact sign test (shoes priced up vs down) and Benjamini-Hochberg corrected across the 24 weeks; the weeks named above are significant at q < 0.001, and Dec 1 shows no change (q = 1). Categories come from product names. Resale sales measure what sold on GOAT and StockX, not total demand. The open-to-buy example is illustrative arithmetic for a hypothetical store, not advice.