Which sneaker sizes run short? Resale prices point to the big sizes
Half of all pairs sold were a men's 9 to 11. But the sizes that sell most are not where the shoes run short. Price shows that, and it points to the big end of the run.
Every sneaker buy ends the same way. The styles are chosen and the total is set, and then someone has to decide how many 8s, how many 10s and how many 13s. Planners call that the size curve. Get it wrong and you end up with a wall of size 8s marked down in January, while the 12s sold out in the first week.
Retailers keep their own size curves private, but resale sales are public. In our inventory planning guide we showed the basic curve. The latest 90 days tell the same story: across 556,629 men's-size sneaker sales on GOAT, half of all pairs were a size 9, 9.5, 10, 10.5 or 11. Size 10 alone was 11.7%. This time we added the part a sales count cannot show.
That part is price. The same shoe resold for less than its typical price in sizes 8 to 9, and for more in 10.5 and up, rising to 33% more in a size 15. Sales counts show where the volume is. Price shows where there were fewer pairs than buyers.
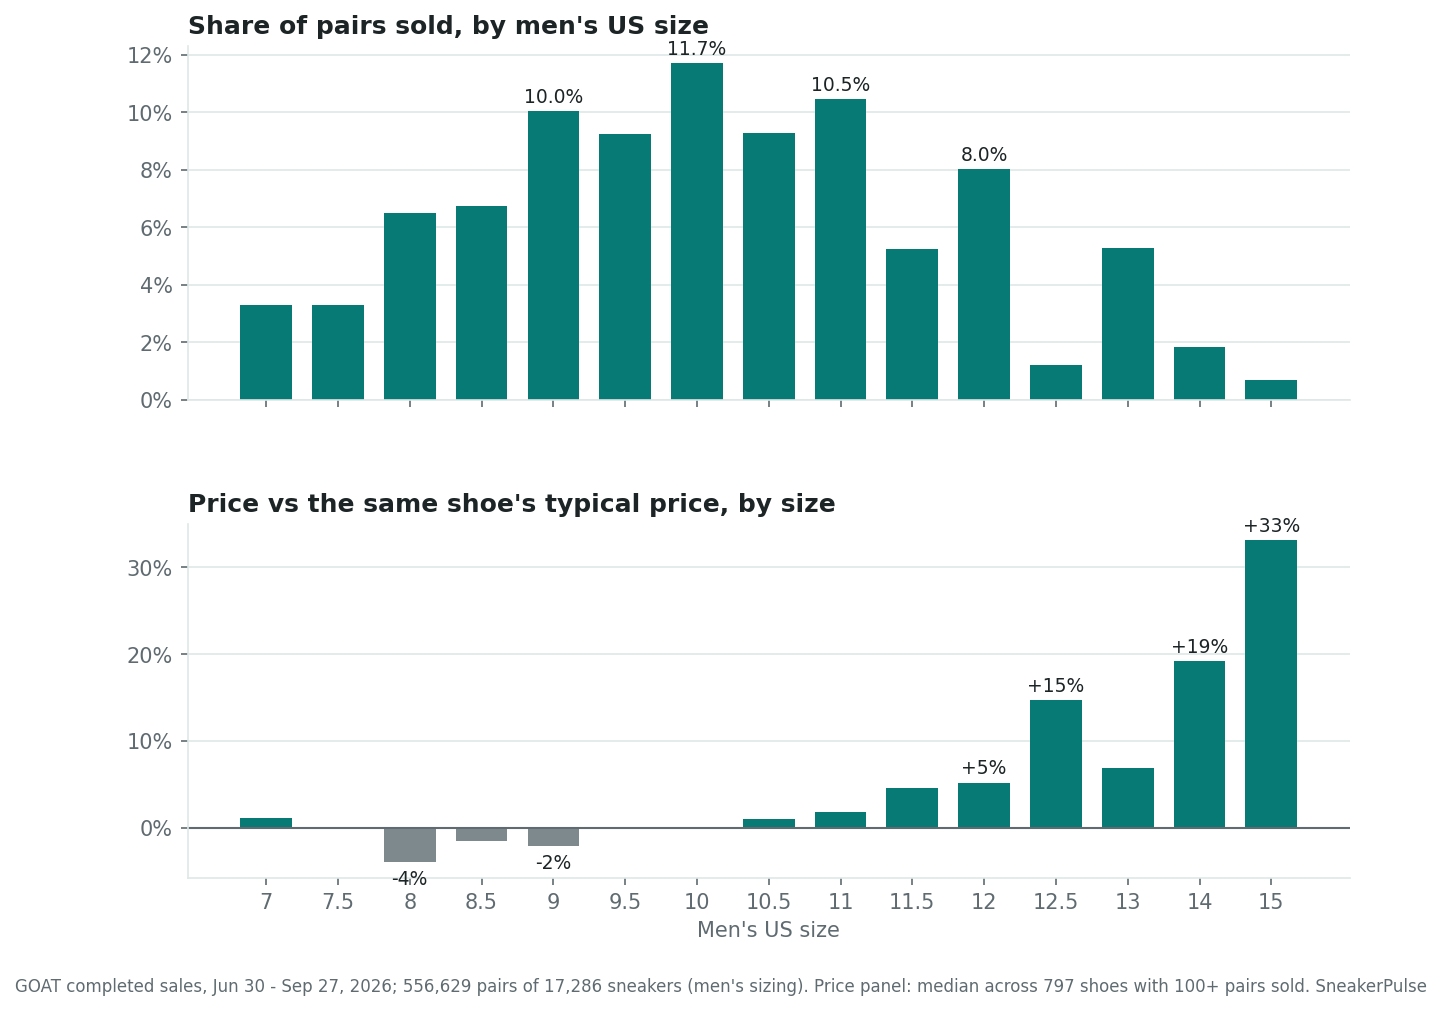
The curve peaks at 10, then drops off at the half sizes
The shape is a bell with gaps. Sizes 9 through 11 carry the volume, and the curve falls off quickly on either side: size 8 is 6.5% of pairs and size 12 is 8.0%.
The gaps show up above 11. A size 11.5 sold 5.2% of pairs, against 8.0% for a 12. A 12.5 sold 1.2%, against 5.3% for a 13. Nobody's feet skip half sizes above 11. Brands simply make far fewer of them, and many models stop making them at all. So this curve shows what sold, which depends on what was made as much as on who wanted it. That is the first thing a planner has to remember about any sell-through number: you can only sell the pairs you bought.
Price tells you which sizes ran short
To get around that, we compared each shoe with itself. For 797 sneakers with at least 100 pairs sold, we took the median price in each size and divided it by that shoe's typical price. Because a Jordan 4 in size 12 is only ever compared with a Jordan 4, mixing cheap and expensive models cannot fake the pattern.
| Men's US size | Share of pairs sold | Price vs same shoe's typical | Shoes priced higher / lower in this size |
|---|---|---|---|
| 8 | 6.5% | -3.9% | 224 / 490 |
| 9 | 10.0% | -2.1% | 202 / 477 |
| 10 | 11.7% | 0.0% | 290 / 328 |
| 11 | 10.5% | +1.7% | 460 / 190 |
| 12 | 8.0% | +5.2% | 511 / 174 |
| 12.5 | 1.2% | +14.7% | 259 / 59 |
| 14 | 1.8% | +19.2% | 384 / 68 |
| 15 | 0.7% | +33.2% | 223 / 23 |
Sizes 8, 8.5 and 9 sold below the shoe's typical price. Size 8 was 3.9% under, and in 490 of 714 shoes the 8s were the cheaper pairs. Put in planning terms, those sizes had more pairs chasing buyers than the other way round. From 10.5 upward the premium climbs, and it is steepest in the rarely made half sizes and the biggest sizes. At size 12, 511 of 685 shoes sold above their typical price. At 15, it was 223 of 246.
Units tell you where the volume is. Price tells you where you ran out.
The two measures together are what matter. Size 12 is not a niche size: it is 8.0% of pairs, more than size 8, and it still clears 5.2% above the typical price. A size run that treats 12 as a tail size gets that wrong. Size 8 is the reverse: plenty of pairs, and they sell at a discount.
A Samba run is not a Jordan run
A single curve for every brand hides a split that matters for anyone buying a mixed-brand assortment.
| Brand group | Pairs sold | Sizes 9 to 11 | Under size 8 | Size 12 and up |
|---|---|---|---|---|
| Jordan | 211,553 | 54.6% | 7.5% | 18.0% |
| Nike (not Jordan) | 164,737 | 51.4% | 9.8% | 20.9% |
| ASICS | 37,316 | 47.2% | 19.6% | 12.5% |
| adidas | 41,257 | 44.5% | 23.7% | 14.1% |
| New Balance | 33,434 | 44.1% | 26.7% | 11.7% |
New Balance sold more than a quarter of its men's-size pairs below a size 8, against 7.5% for Jordan. These are unisex shoes, and many of those small men's sizes are worn by women. A 9060 or a Samba bought on a Jordan size scale ends up short on the small sizes and heavy on the big ones. The Jordan business is the reverse, with nearly one pair in five a 12 or larger.
What this means if you plan inventory
None of this is a forecast, and resale is not a retailer's sales floor. It is the market after the first sale, where the pairs that people bought and did not keep, or bought to flip, find their price. That is why it is useful. It shows, size by size, where the first-round supply fell short of what people would pay for.
The pattern is consistent across hundreds of shoes. Volume sits in 9 to 11. The small middle sizes, 8 to 9, sell at a discount. And the big sizes, which planners habitually treat as a tail, are where the same shoe sells for 5% to 33% more. Unisex brands need their own curve.
You can see any shoe's own size curve on its model page (the Air Jordan 4 and Samba pages have price by size), or look up a single pair in the price checker. For the timing side of the same question, the best time to sell tool uses the same compare-each-shoe-with-itself method.
How we measured this
Methodology: GOAT completed sales from June 30 to September 27, 2026 (90 full days), because StockX sales carry no size. Men's sizing only: listings named GS, PS, TD, BP, kids', infant, toddler, women's or Wmns are excluded because they share size numbers. Also excluded: slides, clogs, mules, sandals, boots, cleats, apparel and collectibles, which leaves 556,629 pairs of 17,286 sneakers. Another 14,348 GOAT sales in the window belong to listings still missing a product name in our database and are not counted. Shares are of all pairs in sizes 4 to 18, so the sizes shown do not add to 100%. Price vs same shoe: for 797 shoes with 100 or more pairs sold, each size's median price (sizes with at least 3 sales) divided by the shoe's pair-weighted median. The table reports the median of that ratio across shoes, with 95% bootstrap intervals (2,000 resamples of shoes): size 8 -3.9% [-4.9, -2.9], 12 +5.2% [+4.4, +6.2], 15 +33.2% [+28.5, +40.9]. Each size was tested with an exact sign test (shoes priced higher vs lower), corrected for the 16 sizes tested with Benjamini-Hochberg. Every size in the tables is significant at q < 0.001 except size 10 (q = 0.15, no difference). Sizes 13.5 (29 shoes) and 14.5 (5 shoes) are too thin to chart. Brand groups use the product name and brand; Yeezy counts as adidas. Resale sales reflect the pairs that reached resale as well as demand, so they are not total demand and not a forecast.