Sneaker inventory planning with resale data: when, what sizes and how fast
A merchandise planner's view of 23 million GOAT and StockX sales. Boots swing sixfold across the year, sizes 9 to 11 are half the business, and a launch does a third of its first half-year in four weeks.
Every sneaker buyer and brand planner works from the same questions. When do I need the inventory? How deep in each size? How fast will a launch sell, and when do prices start to slip? Most answer them with last year's sell-through and a lot of gut feel.
The resale market answers them in public. GOAT and StockX record what people actually paid for millions of pairs after the shelves emptied, which makes resale one of the cleanest demand signals in footwear. We pulled together the patterns a planner would use from nearly 23 million completed sales: a category calendar, a size curve, a launch curve and a weekly rhythm.
The short version: timing matters more than most assortments allow for. Boots take six times more of the market in December than in May. Sizes 9 to 11 are half of all pairs. And a new shoe does a third of its first half-year of resale in its first month.
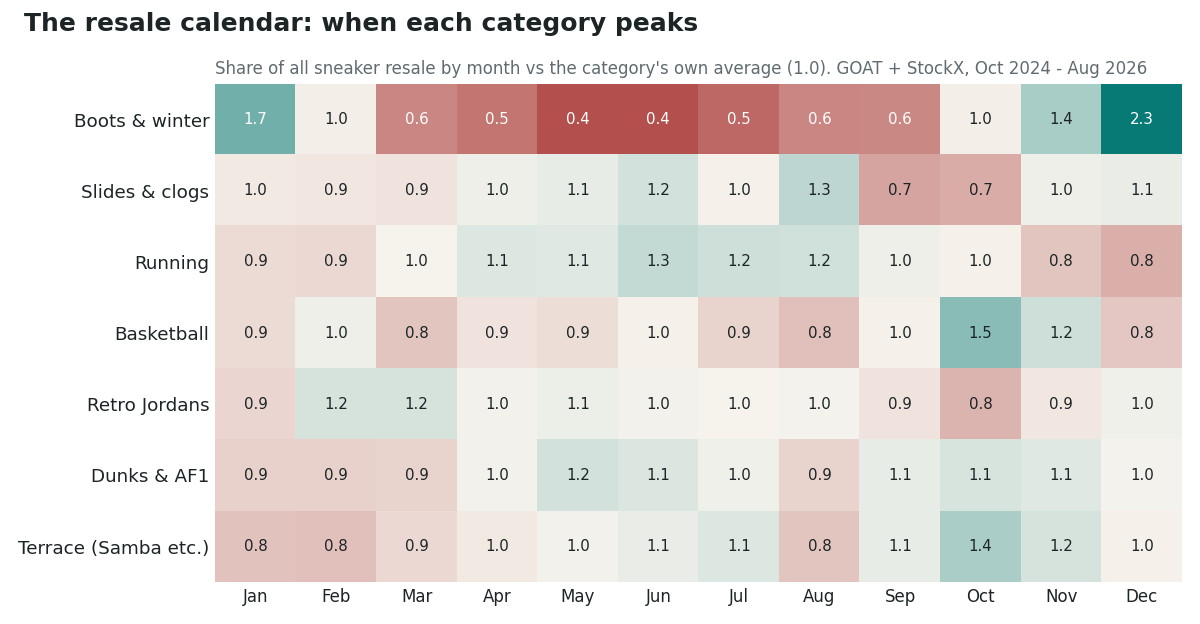
The calendar: some categories are seasons, others are staples
The chart shows each category's share of all sneaker resale in a given month, against its own yearly average. A 2.0 means the category takes twice its normal slice of the market that month. Using share rather than raw sales means market-wide swings, like the holiday rush, don't inflate every category at once.
- Boots and winter shoes are the most seasonal thing in the market: 2.3 times their normal share in December, 1.7 in January and 1.4 in November, then just 0.38 in May. That's a sixfold swing, and it follows the thermometer: in a separate analysis, weeks that turned colder came with a bigger boot share.
- Basketball peaks in October (1.54) and November (1.2), when the NBA season starts, and is softest in August (0.81).
- Running runs warm-weather: 1.1 to 1.3 from April through August, peaking in June, and 0.75 to 0.83 in November and December.
- Terrace shoes (Samba, Gazelle, Campus and friends) peak in October (1.38) and are quietest in January and February (about 0.8).
- Retro Jordans barely have a season: 0.77 to 1.16 all year. They're about a quarter of all resale and behave like a staple.
- Dunks and Air Force 1s lean spring (May 1.18) and early autumn (October 1.15), and are softest in January to March (about 0.87).
- Slides and clogs are strongest in August (1.29) and June (1.18), with a sharp drop in September and October (about 0.7).
For a planner, the difference between a 2.3 month and a 0.4 month is the difference between a sellout and a markdown.
The size curve: half of all pairs are sizes 9 to 11
Across 2.8 million men's-size GOAT sales in the last 12 months (StockX doesn't record sizes), the curve is steep:
| US men's size | Share of pairs |
|---|---|
| 8 / 8.5 | 6.5% / 6.8% |
| 9 / 9.5 | 10.0% / 9.5% |
| 10 / 10.5 | 11.8% / 9.4% |
| 11 / 11.5 | 10.3% / 5.2% |
| 12 | 8.0% |
| 13 | 5.3% |
Size 10 alone is 11.8% of pairs. Sizes 9 to 11 are 51%, and 8.5 to 11.5 are 63%. The tails are thin: 7 and under is 10%, 13 and up 8%. Half sizes above 11 fall off hard: 11.5 sells about half as often as 11, and 12.5 barely registers (1.2%) next to 12 (8.0%), largely because many models aren't made in them.
Resale reflects what's scarce as well as what's wanted, so treat this as a demand-side check on a buy curve, not a replacement for your own sell-through by size.
The launch curve: a third in four weeks, half in eight
We followed 3,162 shoes from their first week with 20 or more resale sales through the following 26 weeks. On average:
- Launch week alone was 11% of those 26 weeks' sales.
- The first 4 weeks were 35%.
- Half had happened by the end of week 8, and two-thirds by week 12.
Prices soften on a similar clock. Across 1,120 launches, the same shoe's median resale price was 5.3% below launch week by week 4, 7.2% below by week 12 and 8.2% below by week 26. Most of the drop comes early, then it flattens.
For planning, that points to allocation and reorder decisions that happen in weeks, not months, and to launch-window stories that matter far more than month-four ones.
The weekly rhythm: Thursday and Friday do 31%
Resale isn't spread evenly across the week. Over 92 complete weeks, Friday carried 15.7% of each week's sales and Sunday 13.0%, against an even 14.3%. Thursday and Friday together were 31%. It's a small edge, but it tells you when a drop or a restock lands on the busiest days. See When Sneakers Sell for the full breakdown.
Leading indicators: searches confirm, they don't forecast
Planners often watch Google Trends as an early warning. In our test of eight models, search interest moved with resale in the same week, not weeks ahead. The one exception was the seasonal UGG Tasman. Searches are a good confirmation that demand is happening. They're a weak forecast of when it will.
A planning calendar from the data
| Category | Build into | Strongest months | Weakest months |
|---|---|---|---|
| Boots & winter | October | Nov-Jan (1.4-2.3) | May-Jun (0.4) |
| Basketball | September | Oct-Nov (1.2-1.5) | Aug (0.8) |
| Running | March | Apr-Aug (1.1-1.3) | Nov-Dec (0.8) |
| Terrace (Samba etc.) | September | Oct-Nov (1.2-1.4) | Jan-Feb (0.8) |
| Slides & clogs | May | Jun, Aug (1.2-1.3) | Sep-Oct (0.7) |
| Retro Jordans | Year-round | Feb-Mar (1.2) | Oct (0.8) |
"Build into" is simply the month before a category's run begins. These are historical patterns from resale, not a forecast for next season, and every assortment has its own story. But if your inventory calendar looks very different from this one, it's worth asking why.
If you plan inventory for a store or a brand and want these cuts for your own categories, models or regions, we build custom reports. You can also check any single shoe in the price checker.
How we measured this
Methodology: Completed resale sales on GOAT and StockX recorded by SneakerPulse, footwear only, October 2024 to August 2026. Categories are matched by shoe name (boots: Timberland, UGG, boots, Gore-Tex; slides: slides, clogs, Crocs, Birkenstock, Foam Runner, mules; running: Pegasus, Vomero, Alphafly, Kayano, Clifton, Ultraboost, Adizero, On Cloud and others; basketball: Kobe, LeBron, Ja, KD, Sabrina, GT Cut, Harden, AE 1, Book 1, Foamposite; Retro Jordans: numbered Jordan 1-14; terrace: Samba, Gazelle, Campus, Spezial, Handball, SL 72, Tokyo). The seasonal index is a category's share of all footwear resale in a month, divided by its average share over the period, averaged over the years available for each calendar month (one or two). May to July 2026 are excluded because our StockX source is missing most best sellers from May 22 to July 3. Size curve: GOAT sales of adult men's listings with a whole or half US size from 4 to 16, last 12 months. Launch curve: shoes whose first week with 20+ sales fell between January 2025 and mid-January 2026 and whose first sale came no more than 60 days earlier (to exclude restocks), with 100+ sales across their first 26 weeks; the share of those sales by week, averaged across shoes. Price after launch: median same-shoe price vs launch week across 1,120 launches (the data behind our Best Time to Sell tool). Weekday shares: each day's share of its own Monday-Sunday week, from our When Sneakers Sell dashboard. Resale demand is a proxy, not retail sell-through. Past data, not a forecast, and not advice.