Does "sell in May and go away" work for sneakers? We tested the Halloween indicator
Stock markets have famously done better from November to April than from May to October. Sneaker resale prices showed no such pattern: over 22 months of StockX sales, the same shoes moved about the same in either half of the year.
"Sell in May and go away" is one of the oldest lines on Wall Street. In 2002, two economists, Sven Bouman and Ben Jacobsen, put it to a proper test in the American Economic Review. They found that stock markets in most of the countries they studied returned more from November through April than from May through October, and named it the Halloween indicator: buy around October 31, sell in May.
Sneakers now trade like a market, with a bid, an ask and a price history for every pair. So we asked whether resale prices have their own Halloween indicator.
They do not. Over 22 months of StockX sales, the same shoes moved about the same in either half of the year. Winter months averaged a 0.17% fall a month; summer months a 0.19% rise. That gap is well inside what chance produces.
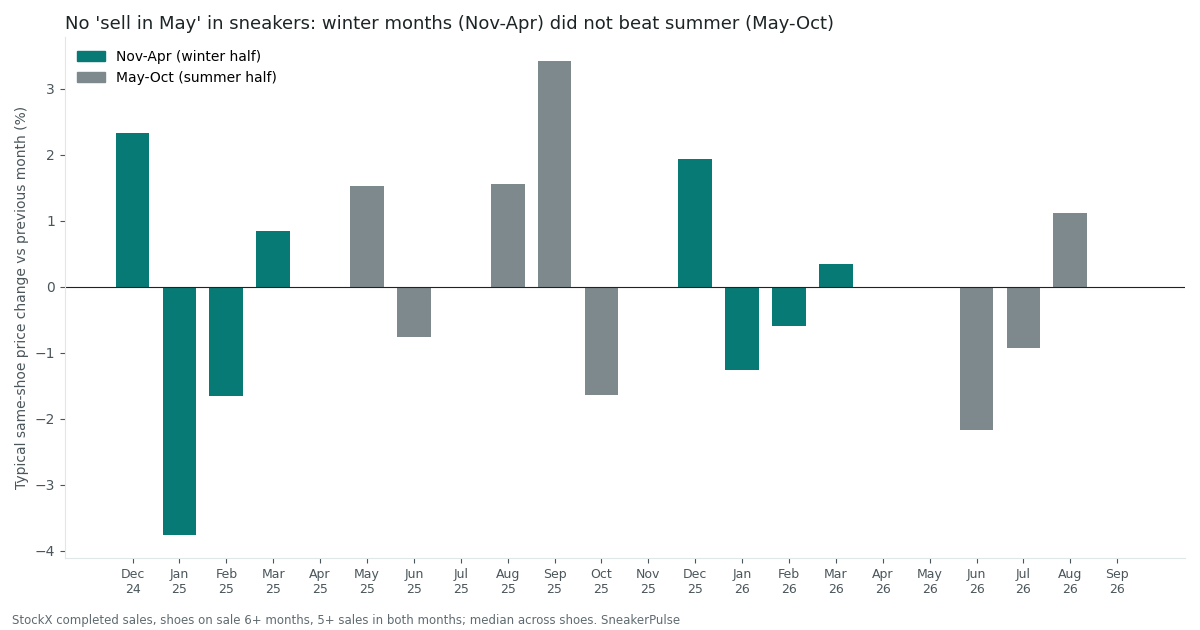
Each half of the year won once
If the Halloween indicator held, every winter half would beat the summer half next to it. Instead, the halves split:
| Half-year | Months measured | Same-shoe price change |
|---|---|---|
| Winter, Dec 2024 to Apr 2025 | 5 | -2.3% |
| Summer, May to Oct 2025 | 6 | +4.1% |
| Winter, Nov 2025 to Apr 2026 | 6 | +0.4% |
| Summer, May to Sep 2026 | 5 | -2.0% |
The first summer beat the winter before it by six points. The second winter beat the summer after it by about two. Put all 22 months together and the difference between a typical winter month and a typical summer month is 0.36 percentage points, in the wrong direction for the indicator. A test that shuffles the season labels finds a gap that size or bigger 62% of the time by chance alone.
Over 22 months, a winter month and a summer month moved the same shoes by about the same amount.
December up, January down: twice, but only twice
One thing does repeat. In both years, the same shoes cost more in December than in November (+2.3% in 2024, +1.9% in 2025) and less in January than in December (-3.8% in 2025, -1.3% in 2026). That would fit holiday gifting: our holiday resale calendar found sales of the same shoes roughly doubled from Black Friday to mid-December 2025 and fell below normal in January. That post saw weekly prices hardly move; the monthly figures here suggest a small price lift on top of the volume surge.
Two Decembers are not a pattern you can test, though. Bouman and Jacobsen had decades of stock returns; we have less than two years of sneaker prices. Read the December bump as something to watch, not a rule.
What it means
For buyers and sellers, the half of the year says little about how a shoe's resale price moves. What moves a pair is the pair: how long since it released, whether it restocks, and what happens to its line. Our same shoes a year later piece shows that kind of shoe-specific drift is far larger than any seasonal swing here.
It is also a reminder of how easy it is to see a pattern in a market's history. The Halloween indicator held up in stocks across many countries and many decades. In sneakers, with 22 months of data, the best we can say is that there is no sign of it yet. We will rerun this test each spring as more months come in, alongside our monthly SneakerPulse Resale Index. This is past sales, not a forecast.
How we measured this
Methodology: StockX completed sales, November 2024 to September 2026 (StockX history in our record starts October 23, 2024; sales after September 18, 2026 are still being loaded, so September 2026 uses the sales present). For each shoe with 5 or more sales in two consecutive months, we took the log change in its median sale price; the month's figure is the median of those changes across shoes, so each shoe is compared only with itself and the mix of shoes cannot fake a move. We kept shoes on sale for at least six months (first recorded sale 180+ days earlier, or a release year before the current year), because new releases lose their launch premium whatever the season; that leaves 1,154 shoes in December 2024 rising to 6,625 in May 2026. Cleats and non-footwear are excluded. Half-year figures chain the monthly medians. The winter-versus-summer test compares the 11 winter and 11 summer months by permutation (20,000 shuffles, two-sided p = 0.62; a Mann-Whitney test gives p = 0.87). With 22 months and one test, no multiple-testing correction applies; the monthly series is short, so we report this as no evidence of an effect rather than evidence of none. Reference: Sven Bouman and Ben Jacobsen, "The Halloween Indicator, 'Sell in May and Go Away': Another Puzzle," American Economic Review 92(5), 1618-1635, 2002.
Keep reading
 Nike Ja 4 'Zombie' resale: last year's Ja 3 Zombie fell below retail, then climbed 17% this OctoberOctober 19, 2026 — 5 min read
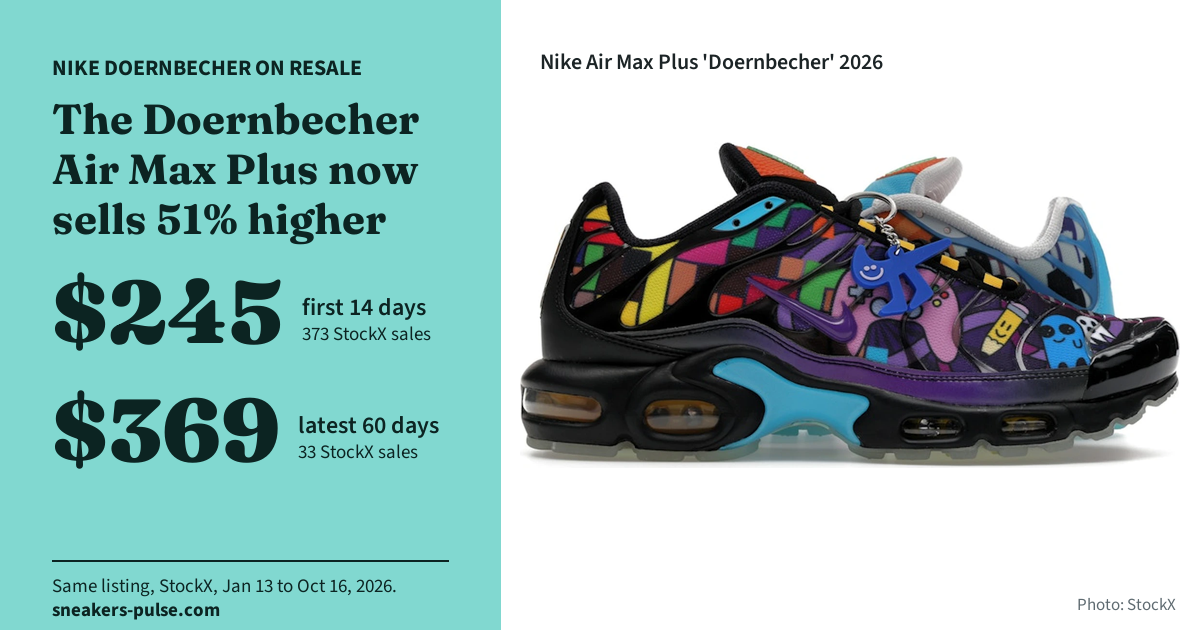 Nike Doernbecher resale prices: last set's Air Max Plus is up 51%, its Jordan down 24%October 17, 2026 — 5 min read
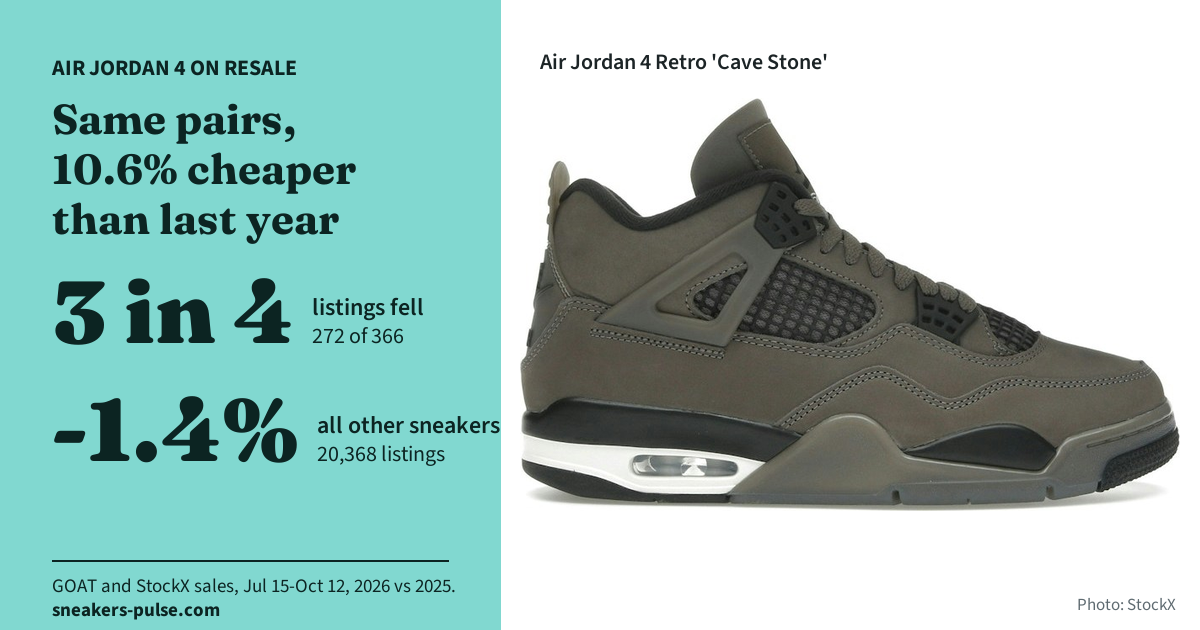 Air Jordan 4 resale prices a year later: the same pairs sell for 10.6% lessOctober 15, 2026 — 5 min read