SneakerPulse Resale Index · September 2026
The same sneakers resold for 7.0% less than a year earlier
The typical shoe resold for the same price in September 2026 as a month earlier, though more shoes fell (4,520) than rose (4,261). Pairs that sold for under $100 a year ago held their value, while pairs that sold for $200 and up lost 11.1%. New Balance fell most (-11.1%); Converse was the only brand clearly up (+21.5%).
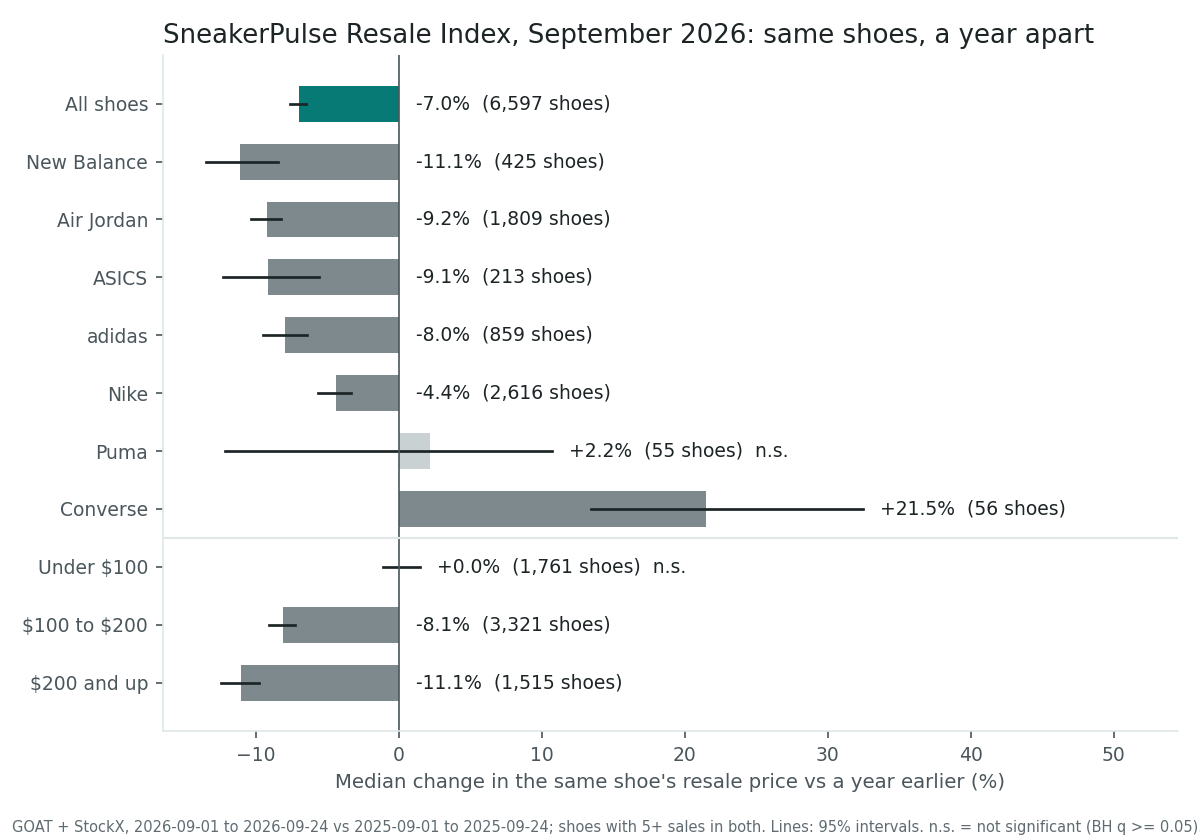
Why most shoes are worth less than a year ago
A shoe that sold a year ago is, by definition, an older release, and releases usually drift down after their launch hype. So the year-on-year number mixes a market-wide move with ordinary ageing, and we do not separate the two here. The month-on-month number has far less ageing in it, which is why it is the better read on what changed recently.
Year over year, by brand and price
| Median change | 95% interval | Shoes | Rose / fell | |
|---|---|---|---|---|
| All shoes | -7.0% | -7.6% to -6.5% | 6,597 | 2,398 / 4,124 |
| New Balance | -11.1% | -13.5% to -8.4% | 425 | 133 / 287 |
| Air Jordan | -9.2% | -10.3% to -8.3% | 1,809 | 524 / 1,267 |
| ASICS | -9.1% | -12.3% to -5.6% | 213 | 69 / 143 |
| adidas | -8.0% | -9.5% to -6.5% | 859 | 305 / 544 |
| Nike | -4.4% | -5.7% to -3.4% | 2,616 | 1,071 / 1,512 |
| Puma | +2.2% (not clear) | -12.2% to +10.7% | 55 | 29 / 25 |
| Converse | +21.5% | +13.5% to +32.5% | 56 | 44 / 11 |
| Under $100 | 0.0% (not clear) | -1.1% to +1.4% | 1,761 | 866 / 862 |
| $100 to $200 | -8.1% | -9.1% to -7.3% | 3,321 | 1,164 / 2,125 |
| $200 and up | -11.1% | -12.4% to -9.8% | 1,515 | 368 / 1,137 |
Month over month, by brand and price
| Median change | 95% interval | Shoes | Rose / fell | |
|---|---|---|---|---|
| All shoes | 0.0% | -0.4% to 0.0% | 9,132 | 4,261 / 4,520 |
| Puma | -5.2% | -7.0% to -1.2% | 93 | 31 / 59 |
| Vans | -1.0% (not clear) | -3.7% to +1.3% | 82 | 34 / 42 |
| New Balance | -1.0% | -2.1% to 0.0% | 554 | 237 / 294 |
| Air Jordan | -0.9% | -1.3% to -0.4% | 2,172 | 967 / 1,149 |
| Nike | 0.0% (not clear) | 0.0% to +0.3% | 3,781 | 1,842 / 1,823 |
| adidas | 0.0% (not clear) | -0.8% to 0.0% | 1,111 | 517 / 548 |
| Converse | 0.0% (not clear) | -2.4% to +1.4% | 98 | 44 / 47 |
| ASICS | +0.8% (not clear) | 0.0% to +2.1% | 321 | 164 / 136 |
| Under $100 | +0.8% | 0.0% to +1.2% | 2,968 | 1,522 / 1,260 |
| $100 to $200 | -0.7% | -0.9% to -0.3% | 4,553 | 2,070 / 2,349 |
| $200 and up | -1.2% | -1.8% to -0.9% | 1,611 | 669 / 911 |
Not clear means the change does not survive Benjamini-Hochberg correction (q ≥ 0.05) across all 23 tests in this report. Price tiers use each shoe's median in the earlier window.
Index history
| Month | vs month before | vs year before | Shoes (YoY) |
|---|---|---|---|
| September 2026 (days 1-24) | 0.0% | -7.0% | 6,597 |
Frequently Asked Questions
Are sneaker resale prices going down in 2026?
The same sneakers resold for 7.0% less than a year earlier: the median change across 6,597 shoes that sold on GOAT or StockX in both Sep 1-Sep 24 2026 and the same days of 2025 was -7.0% (95% interval -7.6% to -6.5%). Part of that is ordinary ageing: shoes that existed a year ago are older releases, and releases tend to drift down after launch. Month over month: the typical shoe resold for the same price in September 2026 as a month earlier, though more shoes fell (4,520) than rose (4,261).
What is the SneakerPulse Resale Index?
A monthly same-shoe price index: each shoe is compared with its own median resale price in the same days of the previous month and of the previous year, so changes in which shoes are selling cannot move it. It is the median of those per-shoe changes, with a bootstrap 95% interval and a sign test on how many shoes rose vs fell.
Can I quote the SneakerPulse Resale Index?
Yes. Please cite "SneakerPulse Resale Index (sneakers-pulse.com/resale-index)". For custom cuts or comment, email [email protected].
Methodology: completed resale sales on GOAT and StockX, footwear only. Each listing (one shoe on one marketplace) with 5+ sales in both windows is compared with itself as the ratio of its median sale prices; the index is the median of those ratios with a seeded bootstrap 95% interval, and an exact sign test on rose vs fell. Windows: Sep 1, 2026 to Sep 24, 2026 vs Aug 1, 2026 to Aug 24, 2026 (month) and Sep 1, 2025 to Sep 24, 2025 (year); the month is cut at the last fully loaded day. StockX sales carry no size, so size mix within a shoe is not controlled. Not financial advice and not a forecast. Related: sneaker resale statistics, this week's movers, free data.