Sneaker Resale Statistics 2026
The typical sneaker now sells for
3.2% less
than the same shoe did a year ago. Popular models, one year on:
More detail
Every shoe with sales in both periods against its own median price 12 months earlier, last 90 days: 23,239 shoes, median change -3.2% (95% interval -3.6% to -2.8%), 10,196 rose, 12,734 fell. Models: 46 with 500+ sales and a year-ago price; cost more or less means the model's same-shoe change clears Benjamini-Hochberg q < 0.05 across all models tested. Past sales, not a forecast.
From 25,924,898 completed sales on GOAT and StockX since October 2024. Updated November 12, 2026. Records are complete through Nov 8; newer days are still filling, so sale counts will rise.
Last year, Black Friday was not cheaper on GOAT and StockX.
Across the 7,330 shoes we tested, the typical shoe sold for the same price as in the two weeks before (Black Friday weekend, Nov 27 to Dec 1, 2025). That is last year, not a forecast for 2026. Black Friday or wait? →
Five numbers to know
 Most sold: Air Jordan 1153,157 sold in the 90 days to Nov 8$128
 Cheapest popular: SambaTypical price, last 90 days$83
 Priciest popular: Nike Kobe 6Typical price, last 90 days$322
 Rose most: Chuck 70Up 28% from a year ago$111
 Fell most: New Balance 1906RDown 13% from a year ago$101
A typical pair, by brand
Air Jordan sells for the most, $178. Puma sells for the least, $96.
The eight best sellers
Most pairs sold in the 90 days to Nov 8, the last complete day.
Air Jordan 1Down 8% from a year ago$128 Air Jordan 4Down 11% from a year ago$186
 Air Force 1About the same as a year ago$127
 Air Jordan 5Down 10% from a year ago$209
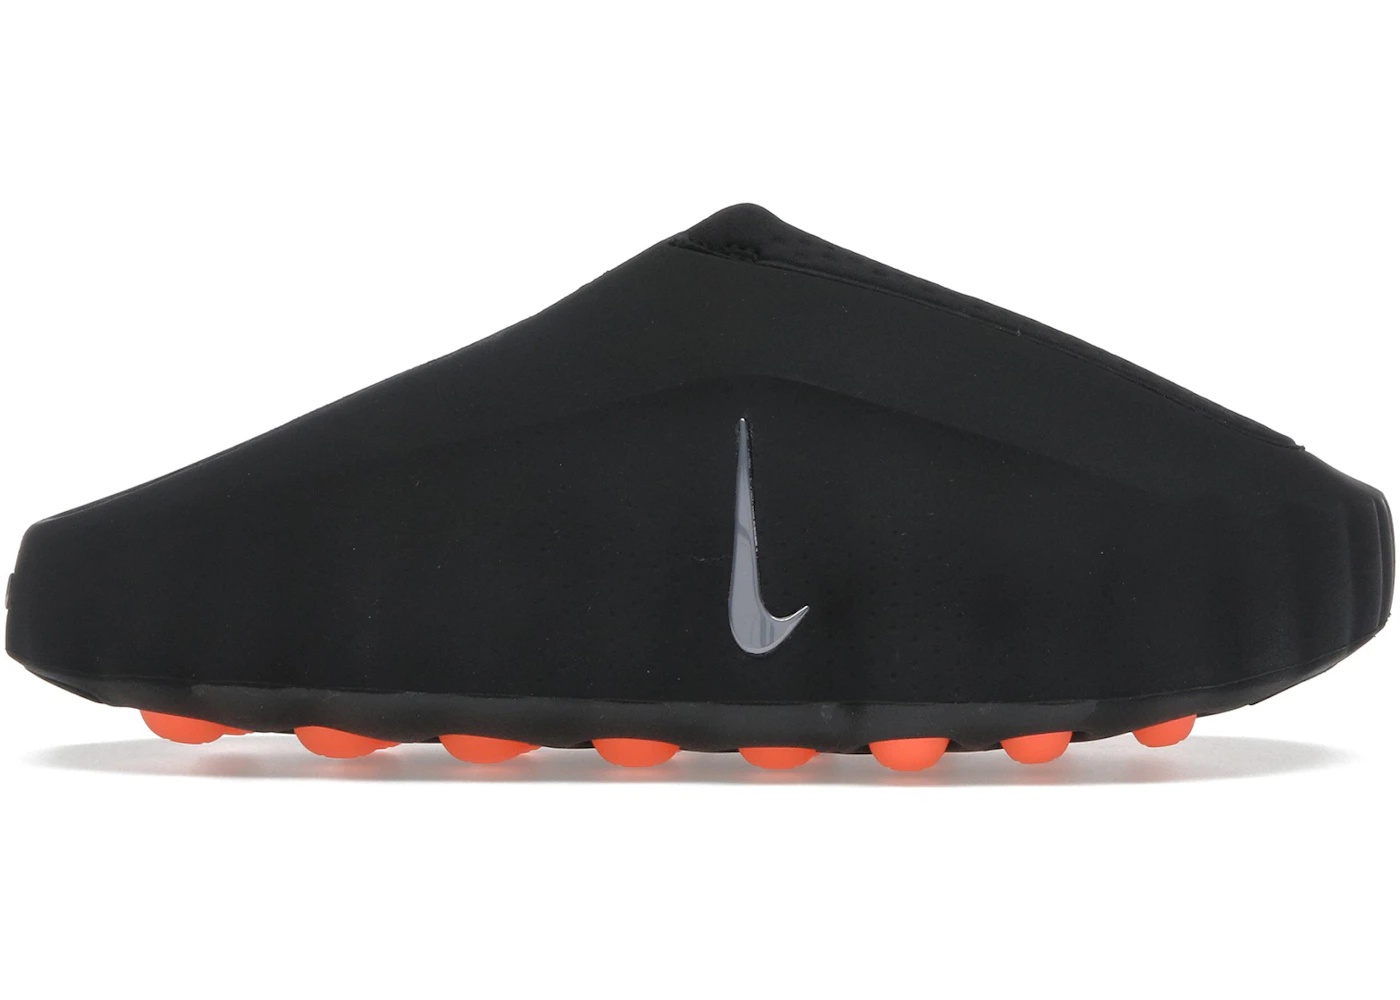 Nike Mind 001No price from a year ago yet$137
 DunkDown 6% from a year ago$91
 Air Jordan 3Down 9% from a year ago$168
 ASICS Gel-1130Down 7% from a year ago$99
Photos: GOAT, StockX.
All the numbers, with windows and samples
The numbers below come from 25,924,898 completed resale sales on GOAT and StockX. Each line states its window and sample, and the figures update daily (last update November 12, 2026). Please cite "SneakerPulse (sneakers-pulse.com)".
- 25,924,898 sneaker resale sales recorded on GOAT and StockX since October 2024.
Worth $4.24B at sale prices, across 301,461 products (apparel and collectibles included). Sales we recorded, not the whole market. - Nike and Air Jordan made up 61% of recorded footwear resale in October 2026.
Nike 32.4%, Air Jordan 28.6%, adidas 6.4%; 683,607 footwear sales that month. - The most-traded model is the Air Jordan 1: 153,157 resales in the 90 days to Nov 8, at a median of $128.
Half of the 150,716 pairs recorded in the last 90 days sold between $92 and $227. That price sample runs to today, so it holds fewer pairs: the newest days are still loading. The sales count stops at the last complete day. - The cheapest popular model on resale is the Samba (median $83); the priciest is the Nike Kobe 6 ($322).
Across the 49 models with 500+ resales in the last 90 days. - 10 of 46 models resell for clearly more than a year ago, and 17 for clearly less.
Same-shoe comparison: each shoe against its own price 12 months earlier, so a shift toward pricier colorways cannot fake a rise. Clearly means Benjamini-Hochberg q < 0.05 across all models tested. - Biggest same-shoe rise: Chuck 70, +28.5% in 12 months.
95% interval +18.8% to +37.5%, 114 shoes compared (85 rose, 28 fell). - Biggest same-shoe fall: New Balance 1906R, -13.0% in 12 months.
95% interval -18.6% to -6.3%, 106 shoes compared (34 rose, 71 fell). - Week to Nov 5: the typical shoe resold for 0.0% more than the week before.
1,820 shoes with 10+ sales in both weeks (Oct 30 to Nov 5 vs the prior 7 days); 860 rose, 871 fell; 95% interval -0.1% to +0.0%.
Every brand: price, sales, change
| Brand | Median price | Sales (90 days) | Same shoe vs a year ago |
|---|---|---|---|
| Nike | $137 | 657.7K | -1.1% (-1.8 to -0.6) |
| Air Jordan | $178 | 601.5K | -7.4% (-8.0 to -6.7) |
| adidas | $103 | 131.2K | -3.6% (-5.3 to -2.1) |
| ASICS | $119 | 96.8K | -4.1% (-6.1 to -2.4) |
| New Balance | $113 | 88.0K | -5.9% (-7.0 to -4.4) |
| Yeezy | $140 | 60.2K | -4.3% (-6.3 to -2.4) |
| Vans | $153 | 35.1K | no clear change |
| Converse | $119 | 18.7K | +14.5% (+7.8 to +21.4) |
| Puma | $96 | 13.1K | no clear change |
Same shoe vs a year ago compares each shoe with its own median price 12 months earlier and reports the median change with a bootstrap 95% interval; no clear change means Benjamini-Hochberg q ≥ 0.05 across all brands or models tested.
All 49 models: price, range, sales, change
| Model | Median price | Middle half of sales | Sales priced (last 90 days, newest still loading) | Same shoe vs a year ago |
|---|---|---|---|---|
| Air Jordan 1 | $128 | $92 to $227 | 150.7K | -7.5% (-8.7 to -6.5) |
| Air Jordan 4 | $186 | $148 to $265 | 128.5K | -10.7% (-12.4 to -9.5) |
| Air Force 1 | $127 | $89 to $170 | 77.7K | no clear change |
| Nike Mind 001 | $137 | $118 to $163 | 62.7K | n/a |
| Air Jordan 5 | $209 | $167 to $255 | 61.6K | -9.5% (-10.9 to -8.2) |
| Dunk | $91 | $65 to $125 | 46.9K | -6.1% (-7.5 to -4.7) |
| Air Jordan 3 | $168 | $132 to $210 | 46.3K | -9.2% (-10.5 to -7.0) |
| Air Jordan 11 | $226 | $154 to $285 | 43.2K | -8.2% (-10.1 to -6.1) |
| ASICS Gel-1130 | $99 | $89 to $115 | 41.5K | -6.6% (-9.3 to -2.3) |
| Samba | $83 | $65 to $124 | 32.9K | no clear change |
| Air Jordan 12 | $179 | $157 to $211 | 30.9K | -4.8% (-7.7 to -2.7) |
| Air Jordan 6 | $168 | $145 to $235 | 28.6K | -5.1% (-8.4 to -3.3) |
| New Balance 9060 | $107 | $95 to $136 | 27.4K | -8.2% (-10.1 to -6.8) |
| Vans Old Skool | $155 | $136 to $190 | 25.4K | no clear change |
| Air Max 95 | $154 | $125 to $195 | 25.3K | -11.5% (-15.8 to -7.4) |
| Air Jordan 9 | $215 | $157 to $240 | 24.4K | -9.5% (-13.6 to -5.9) |
| Dunk SB | $164 | $116 to $250 | 21.4K | -7.3% (-8.6 to -5.9) |
| Yeezy Boost 350 | $196 | $145 to $254 | 21.1K | no clear change |
| Nike Vomero 5 | $114 | $100 to $133 | 20.4K | no clear change |
| Air Jordan 8 | $199 | $179 to $217 | 18.5K | no clear change |
| ASICS Gel-Kayano 14 | $139 | $119 to $168 | 17.8K | no clear change |
| Air Max 90 | $137 | $94 to $185 | 17.8K | +4.0% (+1.6 to +6.7) |
| Onitsuka Tiger Mexico 66 | $137 | $121 to $157 | 16.8K | no clear change |
| Air Jordan 14 | $207 | $174 to $274 | 16.3K | no clear change |
| Air Jordan 13 | $155 | $141 to $184 | 15.8K | no clear change |
| ASICS Gel-NYC | $130 | $110 to $164 | 13.4K | no clear change |
| Air Max 1 | $165 | $115 to $218 | 12.6K | +8.5% (+6.2 to +11.6) |
| Nike Kobe 6 | $322 | $250 to $403 | 12.2K | +10.2% (+7.6 to +17.7) |
| 2002R | $124 | $108 to $152 | 11.9K | no clear change |
| Nike P-6000 | $103 | $90 to $130 | 11.7K | +7.5% (+1.9 to +11.4) |
| Yeezy Slide | $128 | $99 to $159 | 11.3K | -12.1% (-14.7 to -8.6) |
| Air Max Plus | $202 | $140 to $325 | 10.8K | +6.0% (+2.2 to +10.6) |
| Puma Speedcat | $92 | $76 to $116 | 7.7K | no clear change |
| Blazer | $90 | $75 to $116 | 7.3K | no clear change |
| Air VaporMax | $136 | $124 to $172 | 7.1K | +6.2% (+3.3 to +13.2) |
| New Balance 530 | $92 | $73 to $118 | 6.9K | -10.1% (-15.8 to -7.5) |
| Gazelle | $102 | $69 to $142 | 6.9K | -8.4% (-11.7 to -3.0) |
| UltraBoost | $114 | $89 to $154 | 6.7K | +10.4% (+5.0 to +17.7) |
| New Balance 1906R | $101 | $88 to $132 | 6.6K | -13.0% (-18.6 to -6.3) |
| Converse SHAI 001 | $125 | $105 to $158 | 6.4K | n/a |
| 990 | $144 | $115 to $198 | 5.2K | +3.6% (+0.7 to +7.9) |
| Chuck 70 | $111 | $89 to $148 | 5.2K | +28.5% (+18.8 to +37.5) |
| Superstar | $110 | $75 to $173 | 4.8K | no clear change |
| Air Max 270 | $95 | $85 to $111 | 4.4K | no clear change |
| Air Max 97 | $137 | $111 to $191 | 2.9K | +10.5% (+1.0 to +13.8) |
| Vans Knu Skool | $98 | $59 to $209 | 2.2K | n/a |
| Forum | $125 | $92 to $190 | 1.4K | no clear change |
| 574 | $90 | $71 to $133 | 1.3K | no clear change |
| NMD Runner | $124 | $82 to $180 | 1.1K | no clear change |
Same shoe vs a year ago compares each shoe with its own median price 12 months earlier and reports the median change with a bootstrap 95% interval; no clear change means Benjamini-Hochberg q ≥ 0.05 across all brands or models tested.
Frequently Asked Questions
What is the average resale price of sneakers?
The typical (median) resale price over the last 90 days is $137 for Nike, $178 for Air Jordan and $103 for adidas, from completed GOAT and StockX sales.
Do sneakers hold their value on resale?
It depends on the model. Comparing each shoe with its own price a year earlier, 10 of 46 popular models resell for clearly more and 17 for clearly less; the biggest rise is the Chuck 70 (+28.5%) and the biggest fall the New Balance 1906R (-13.0%).
Which sneaker brand has the most resale sales?
In October 2026, Nike had 32.4% of recorded footwear resale sales on GOAT and StockX, then Air Jordan (28.6%) and adidas (6.4%).
Where do these sneaker statistics come from?
From SneakerPulse's database of completed resale transactions on GOAT and StockX, refreshed daily. The monthly series are free to download as CSV (CC BY 4.0) at sneakers-pulse.com/free-data and on Kaggle.
Methodology: completed resale sales recorded from GOAT and StockX. Medians and ranges cover the last 90 days; brand and model figures exclude apparel, trading cards and collectibles. StockX sells new pairs only; GOAT also sells used pairs and we cannot tell them apart. Volume is what our feed recorded, not the whole market, and coverage has grown over time, so volume is not compared year over year. Data: free CSV downloads, Kaggle dataset. Related: monthly Resale Index, market data, price checker, blog.