Do Google searches predict sneaker sales? We tested 8 popular models
Searches and resale sales rise in the same week, not weeks apart. For five of the eight shoes we tested, search swings didn't line up with sales at all. The one real head start belongs to the UGG Tasman.
Before people buy a shoe, they search for it. So you'd expect Google to act like an early warning system: searches for a sneaker climb, and a few weeks later the sales follow. Marketers watch Google Trends for exactly this reason.
We tested it on eight of the most popular sneakers on the resale market, week by week for two years, against each model's share of sales on GOAT and StockX.
The answer: searches and sales move together, in the same week. They don't give you a head start. And for five of the eight models, search swings didn't line up with sales at all.
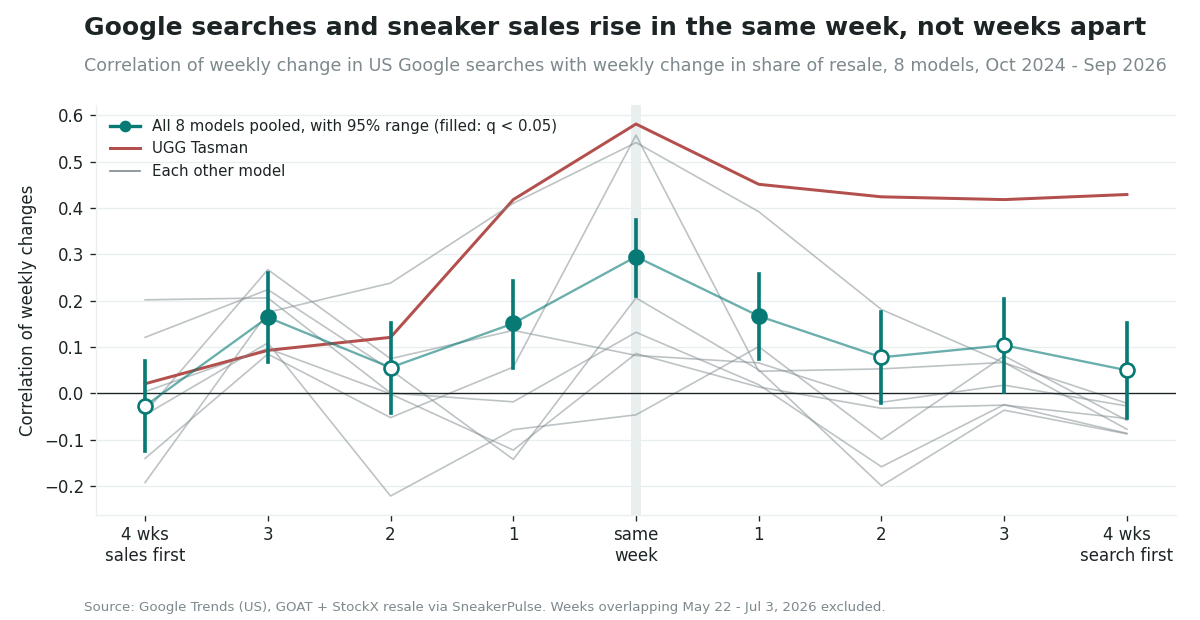
Searches and sales peak together
We compared changes, not levels. For each model and each week, we asked: did searches rise or fall compared with the week before, and did the model's share of all sneaker resale rise or fall? Then we slid the two series against each other, from sales four weeks ahead to searches four weeks ahead, to see where they line up best.
Pooled across all eight models, the match is strongest in the same week: a correlation of 0.30 (95% range 0.21 to 0.38). That's a real but moderate link. Weeks when searches jump more than usual tend to be weeks when that shoe takes a bigger slice of resale.
Shift the searches one week earlier and the link weakens to 0.17. Shift them two to four weeks earlier and it fades to 0.05 to 0.10, none of which survives the standard correction for testing 82 things at once (all q > 0.1, where anything above 0.05 means "could easily be chance").
Google searches tell you what's selling this week. They don't tell you what will sell next month.
The link is also symmetric. Sales one week before searches correlate about as well (0.15) as searches one week before sales (0.17). That's what you'd expect if both are reacting to the same thing, a release, a restock, a cold snap or a viral post, rather than one causing the other.
One result we can't explain: pooled, sales changes three weeks before search changes show a small link (0.16, q = 0.01). It is spread across several models, none of which is significant on its own at that gap, and it points the wrong way for the "searches predict sales" idea.
Three shoes track their searches closely. Five don't.
The pooled number hides a split.
| Model | Same-week correlation | 95% range | Pairs resold in the weeks we used |
|---|---|---|---|
| UGG Tasman | 0.58 | 0.34 to 0.75 | 150,356 |
| Jordan 4 | 0.56 | 0.39 to 0.69 | 1,416,477 |
| Asics Gel-1130 | 0.54 | 0.32 to 0.70 | 584,217 |
| Nike Dunk | 0.21 | 0.00 to 0.40 | 1,197,549 |
| New Balance 9060 | 0.13 | -0.09 to 0.34 | 374,525 |
| adidas Samba | 0.09 | -0.12 to 0.29 | 427,644 |
| Yeezy Slide | 0.08 | -0.13 to 0.29 | 322,634 |
| Air Force 1 | -0.05 | -0.25 to 0.16 | 675,084 |
Jordan 4, UGG Tasman and Asics Gel-1130 move with their searches, and each result holds after correction (q ≤ 0.001). For the Jordan 4, a plausible reason is big release weeks like the Black Cat and White Cement retros, when searches and sales spike together, though we didn't test that directly.
For the Nike Dunk, New Balance 9060, adidas Samba, Yeezy Slide and Air Force 1, no test at any time gap survives correction. These are shoes people search for all the time, as everyday names, so a week with more searches doesn't mean a week with more resale.
The UGG Tasman is the exception that has a head start
The one model where searches do seem to come first is the UGG Tasman. When its searches rise, its share of resale keeps rising for weeks afterwards: the correlation stays between 0.42 and 0.45 with searches one to four weeks ahead, each surviving correction (q between 0.02 and 0.05). The reverse doesn't hold: sales two to four weeks before searches show no link (0.02 to 0.12).
That fits a shoe with a strong season. Every autumn, interest in the Tasman climbs week after week toward the holidays, and sales climb with it. Searches pick up the turn a little sooner. But it's one seasonal slipper, measured over two winters, so treat it as a pattern in the past rather than a rule.
What this means for buyers and sellers
If you're watching Google Trends to guess where resale is going, the last two years suggest it mostly shows you the present. A spike in searches for a Jordan 4 or a Gel-1130 lines up with a busy week on resale, not with a busier one ahead. For everyday staples like the Dunk and Air Force 1, search interest says little about sales at all.
The UGG Tasman is the one case where searches ran slightly ahead, and that looks tied to its season more than to search itself.
Want to see what a pair is selling for right now? Use the price checker, browse the slides and comfort shoes people are buying, or read whether NBA stars' big games sell their sneakers.
How we measured this
Methodology: Search data from Google Trends, US, weekly (Sunday-start weeks), 2024-09-01 to 2026-09-24, one term per request: "adidas Samba", "Jordan 4", "Yeezy Slide", "UGG Tasman", "New Balance 9060", "Asics Gel 1130", "Nike Dunk", "Air Force 1". Google Trends is a relative 0-100 index, not a count of searches, so we only use each term's week-over-week log change. Resale: completed GOAT and StockX footwear sales, weeks starting 2024-09-29 through 2026-09-13 (US Eastern time), matched by shoe name (all Sambas including OG and XLG; Jordan 4 but not 40-series; all Dunks; Air Force 1 but not 10-series). Each model's weekly sales are divided by all footwear resale that week, so our growing coverage and market-wide swings cancel out; we use the week-over-week log change of that share. We dropped weeks overlapping May 22 to July 3, 2026, when our StockX source is missing most best sellers, and the last partial week, leaving 96 weeks. Cross-correlations at gaps of -4 to +4 weeks per model and pooled (each model's changes demeaned, then combined), with p-values from a t-test on the Pyper-Peterman effective sample size to allow for autocorrelation, 95% Fisher ranges, and Benjamini-Hochberg correction across all 82 tests (8 models x 9 gaps, 9 pooled, plus one robustness check). Searches for five terms surged together from late March to mid-May 2026; removing those weeks leaves the pooled same-week result unchanged (0.32, range 0.23 to 0.41). Correlation is not causation. Past data, not a forecast, and not buying advice.