When do UGGs sell the most? UGG resale sales by month, and which year was bigger
One week in December does more business than all of spring. And last winter was far quieter than the one before.
UGGs are the most seasonal product we track. Between October 2024 and August 2026 we recorded 361,818 UGG footwear resale sales on GOAT and StockX. Both winters peaked in the same week of December and bottomed out in June. The winter of 2024-25 was much bigger than 2025-26, both in raw sales and on a same-shoe comparison that removes changes in what we track.
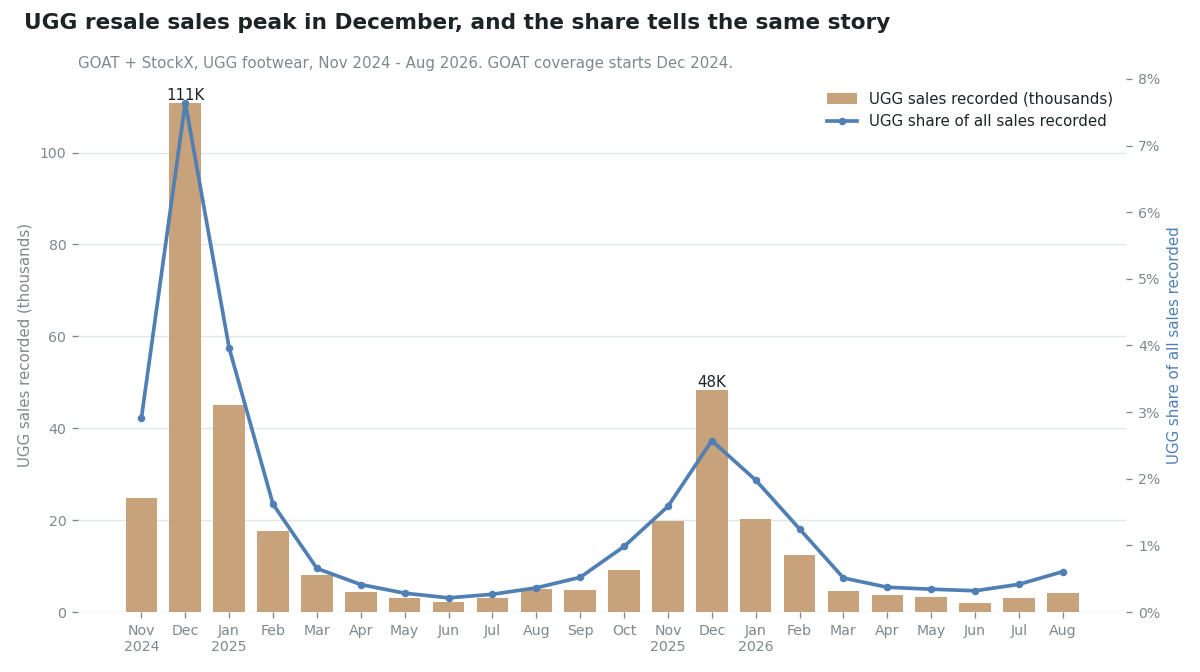
The busiest months: November to January, with December on top
| Month | 2024-25 season | Share of all sales | 2025-26 season | Share of all sales |
|---|---|---|---|---|
| October | 1,823* | 1.33% | 9,170 | 0.99% |
| November | 24,800 | 2.91% | 19,895 | 1.59% |
| December | 110,687 | 7.64% | 48,271 | 2.57% |
| January | 45,034 | 3.96% | 20,216 | 1.98% |
| February | 17,747 | 1.62% | 12,433 | 1.25% |
| March | 8,100 | 0.66% | 4,662 | 0.51% |
| June (low) | 2,152 | 0.21% | 2,057 | 0.32% |
| August | 4,944 | 0.36% | 4,226 | 0.61% |
*October 2024 is partial: our UGG records start October 24.
- December is the peak both years. It held 48% of all UGG sales in the 2024-25 season (October to September) and 37% in 2025-26.
- The single busiest week was the same both years: December 11-17, 2024 (33,292 sales) and December 12-18, 2025 (14,347). The busiest days were December 13, 2024 and December 17, 2025. After Christmas, daily sales fell by more than a quarter (3,747 a day on average for December 1-24, 2024, then 2,715 for December 26-31).
- Black Friday shows up. November 28, 2025 was the fourth-busiest day of that season.
- Summer is quiet. From April to July, UGGs made up less than half a percent of the sales we recorded, against 7.6% in December 2024.
The share column matters because total sales on the site change from month to month too. Measured as a share, the December peak and June low are just as clear.
Prices move with the season too
To check price separately from mix, we compared each sale with that same shoe's own median over the whole window (products with 50+ sales), then took the monthly median of those ratios. That way, a month where pricier styles sell more does not look like a price rise.
| Priciest month | vs shoe's median | Cheapest month | vs shoe's median | |
|---|---|---|---|---|
| 2024-25 | December 2024 | +5.7% | June 2025 | -17.1% |
| 2025-26 | November 2025 | +3.2% | June 2026 | -27.8% |
In both seasons, the same shoes sold for more in November and December than in June: 23 points apart in 2024-25 and 31 in 2025-26. Part of the gap is age. Every shoe is being compared with its average over nearly two years, and older pairs tend to drift down. So read the exact percentages loosely. The direction, dear in winter and cheap in summer, is the same both years. That describes what happened; it is not a forecast. If you are listing a pair, the best time to sell tool and the fee calculator show what you would take home.
Which year had the most UGG sales?
By calendar year, 2025 has the most recorded UGG sales (170,788), but that is only because it is the one full year we have. 2024 only covers October to December, and those three months alone came to 137,310 sales. 2026 so far (January to August) has 53,720.
The fair comparison is season against season:
| Measure | 2024-25 | 2025-26 | Change |
|---|---|---|---|
| UGG sales, October-September | 230,762 | 131,056 (to August) | -43% |
| UGG sales, November-February | 198,268 | 100,815 | -49% |
| UGG share of all sales, November-February | 4.37% | 1.96% | -2.4 points |
| Same 216 UGG shoes on StockX, November-February | 167,366 | 46,370 | -72% |
| Same 8,341 non-UGG shoes on StockX, November-February | 2,749,984 | 1,351,376 | -51% |
Raw year-over-year counts can mislead in resale data, because the set of products we record grows and changes. The last two rows fix that by following only shoes that sold 20 or more times on StockX in both winters. Even on the same shoes, UGG sales fell further than the market did: 28% of the previous winter's level, against 49% for everything else. By every measure we have, 2024-25 was the bigger UGG year.
What people were buying
| Model family | 2024-25 | 2025-26 |
|---|---|---|
| Tasman (incl. Tasman II) | 104,208 | 42,638 |
| Tazz (incl. Tazz II) | 50,344 | 14,148 |
| Lowmel | 29,283 | 20,671 |
| Classic Ultra Mini (incl. Platform) | 15,733 | 16,060 |
The drop came mostly from the Tasman and Tazz slippers, the two styles behind the 2024 surge. Within the Tasman family, sales moved to the Tasman II (11,619 to 29,272). The Classic Ultra Mini was the one big line that held level across both winters. To see which models are gaining or losing share right now, see the trending page; to look up recorded sales for a specific pair, use the sneaker price checker.
How we measured this
Methodology: GOAT and StockX resale sales recorded via kicks.dev, October 24, 2024 to August 31, 2026 (UTC dates). UGG-branded footwear only: hoodies, bags, socks, blankets and other non-footwear are excluded by product name. Sales between $10 and $5,000. GOAT records start in December 2024, so the season-against-season rows that need a full November use StockX alone or both platforms as labelled. "Share" is UGG sales divided by all sales we recorded that month. These are recorded resale sales, not UGG's total sales or the size of the market. With two seasons of data, we can say the pattern repeated, but not how reliably it will repeat.