Sneaker resale prices in September 2026 - the same shoes sold for 7% less than a year ago
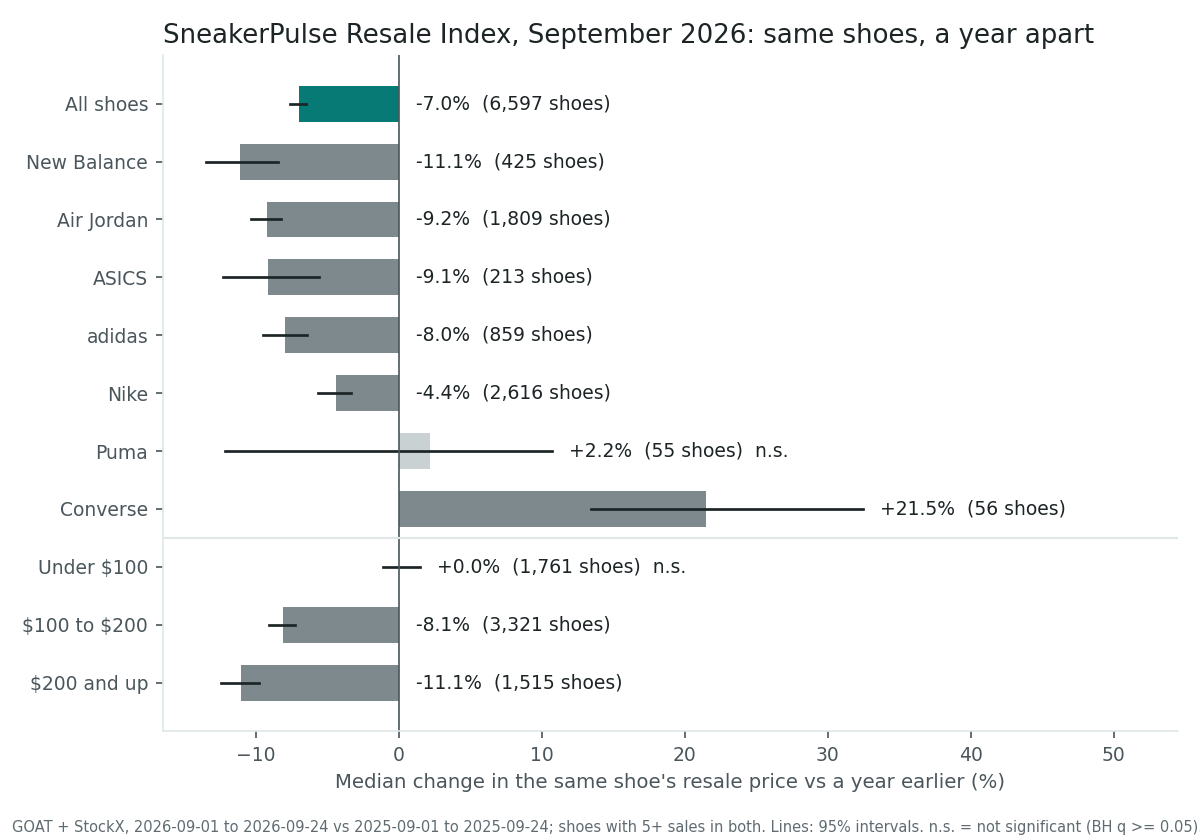
Compare each sneaker only with itself and September's resale prices were flat on August, but 7.0% below the same shoes a year earlier. Pricier pairs fell hardest; Converse was the one brand that clearly rose.
"The resale market is dead" gets said every few months, usually off the back of one shoe that flopped. The trouble with checking it is that average sale prices move with the mix: a month full of cheap slides looks like a crash, and a month of big Jordan drops looks like a boom.
So we compare each sneaker only with itself. Take every shoe that sold at least five times in September 2026 and also in September 2025, compare its median price in the two months, and take the middle of those changes. That is the SneakerPulse Resale Index.
For September it says: the same shoes resold for 7.0% less than a year earlier, and almost exactly what they fetched in August.
A year down, a month flat
Across 6,860 shoes, the middle change was -7.0% (95% interval -7.4% to -6.3%). It is not a few big losers dragging an average: 4,290 shoes fell and 2,489 rose, so nearly two in three were cheaper than a year ago.
Against August the picture is calm. Across 9,407 shoes the typical change was 0.0% (interval -0.3% to 0.0%). Slightly more shoes fell (4,627) than rose (4,370), a tilt that is real statistically but small: it moves the typical shoe by less than a third of a percent.
The same sneakers resold for 7% less than a year ago, and for the same price as in August.
The more a pair cost, the more it lost
The drop is concentrated at the top of the market.
| Price a year ago | Same-shoe change | 95% interval | Shoes | Rose / fell |
|---|---|---|---|---|
| Under $100 | 0.0% | -1.3% to +1.4% | 1,843 | 908 / 908 |
| $100 to $200 | -7.9% | -8.8% to -7.0% | 3,449 | 1,194 / 2,210 |
| $200 and up | -10.2% | -11.1% to -9.5% | 1,568 | 387 / 1,172 |
Pairs that sold for under $100 a year ago held their value exactly: 908 rose and 908 fell. Pairs above $200 lost a tenth, and three in four of them fell. The month-on-month numbers lean the same way, more gently: under-$100 shoes rose 0.5% on August, $200-plus shoes fell 1.2%.
Converse was the only brand clearly up
By brand, New Balance (-10.3%), Air Jordan (-9.3%), ASICS (-9.3%) and adidas (-8.6%) all fell by similar amounts. Nike held up better at -4.3%. Puma's +1.1% is too uncertain to call either way.
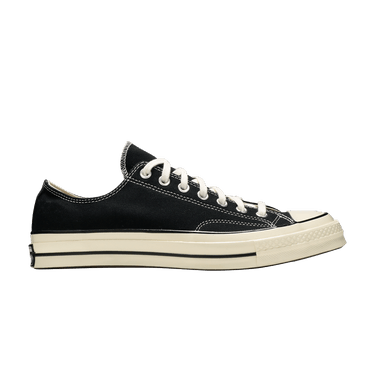
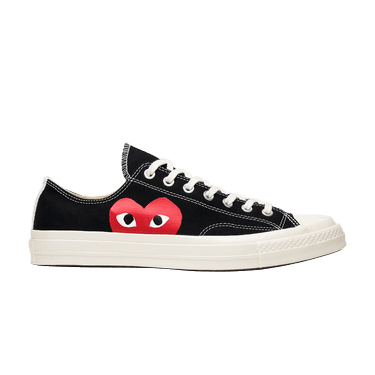
Converse went the other way, +18.1%, on a smaller base of 68 shoes. The rise comes from the Chuck 70: the plain black Chuck 70 Low went from a $51 median to $96, and 26 of the 28 Comme des Garçons Play Chucks we could compare rose (the black CDG Chuck 70 Low from $81 to $150). Converse's one big loser was a new shoe: the SHAI 001 'Charm Black' fell from $294 at launch to $125.
Against August, only two brands were clearly down: Air Jordan (-0.8%) and Puma (-5.4%). The Jordan slide has not stopped.
Why most shoes are worth less than a year ago
Part of this is just ageing. A shoe that sold in September 2025 was already on the market, and releases tend to drift down once launch hype passes. The year-on-year number mixes that drift with any real cooling of demand, and we do not separate the two here. That is why the month-on-month figure is the better read on what changed recently, and it says September was steady.
What it means if you are selling: a pair you bought for $250 last autumn is, on these numbers, probably worth less than you remember, while a sub-$100 shoe has typically held. Check your exact shoe and size in the price checker rather than relying on the market-wide figure, and see the full table, with every brand, on the Resale Index page. The trending page shows which individual shoes moved most this week.
How we measured this
Methodology: completed resale sales recorded from GOAT and StockX, footwear only, September 1-29, 2026 (the last fully loaded day) against the same days of 2025 for the year-on-year index and of August 2026 for month-on-month. A shoe is one marketplace listing and counts when it has 5 or more sales in both windows. The index is the median of each shoe's log price change, with a seeded bootstrap 95% interval; rose vs fell counts use exact sign tests with Wilson intervals. Brand and price-tier results are corrected for multiple testing with Benjamini-Hochberg across all 23 tests in the report (q < 0.05 to count as significant). StockX sells new pairs only; GOAT also sells used pairs. Year-on-year changes include normal post-release ageing. Patterns, not forecasts or advice.