How much are my sneakers worth? Check in a few minutes with real sold prices
Match the exact pair and year, check your size, then read the range of sold prices, not one number. The middle half of sales typically spans about 23% of the median.
You have a pair in the closet and you want to know what it is worth. Search it and you get a wall of asking prices, old listings and one-line guesses. The honest answer is not one number, and a few minutes of checking gets you to a good range.


Here is the short version. Find the exact shoe and year, check your size, and look at what pairs actually sold for, as a range. The rest of this guide shows each step with the numbers behind it.
1. Find the exact shoe, including the year it was released
Look inside the shoe, on the tongue tag or the box label, for the style code (it looks like FV5029-010). Search that code, not the nickname. A colorway that gets re-released is a different product every time, and buyers price it that way.
| Shoe (StockX) | Earlier release | Later release |
|---|---|---|
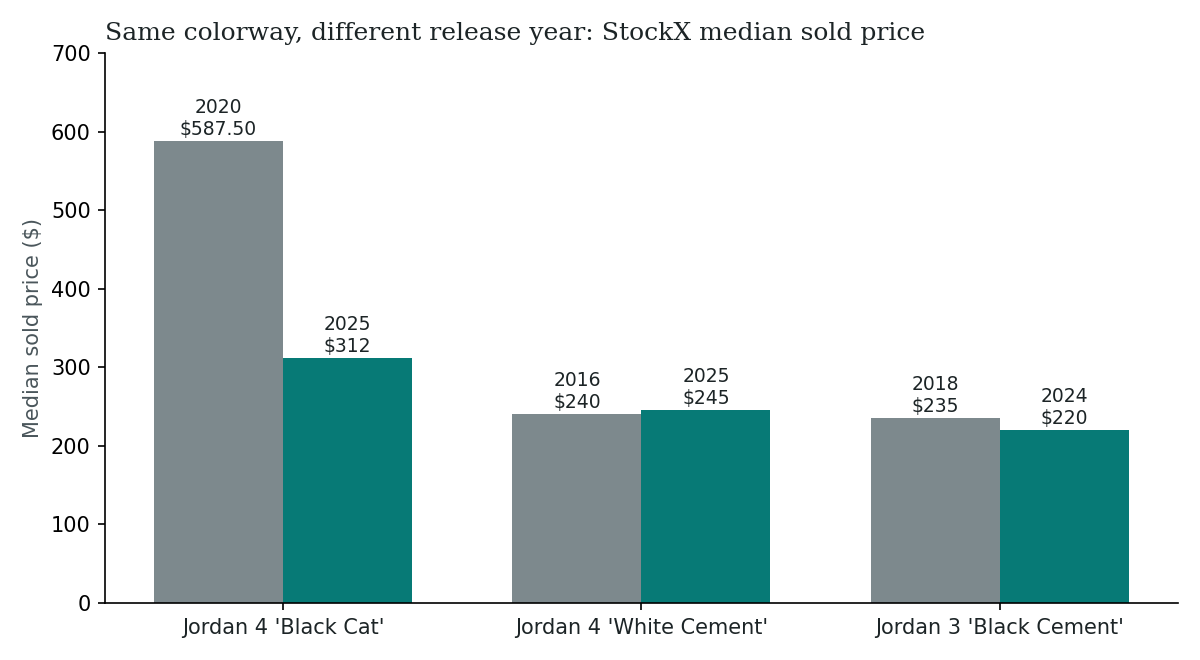
| Jordan 4 'Black Cat' | 2020: $587.50 (100 sales) | 2025: $312 (6,553 sales) |
| Jordan 4 'White Cement' | 2016: $240 (133 sales) | 2025: $245 (4,082 sales) |
| Jordan 3 'Black Cement' | 2018: $235 (159 sales) | 2024: $220 (1,745 sales) |
Median sold price, July 6 to October 3, 2026.
The 2020 Black Cat sold for a median $275.50 more than the 2025 re-release. The two White Cements sold within $5 of each other.
So the year can matter a lot, or not at all. You only find out by checking the code. The two Black Cats even have different codes (CU1110-010 and FV5029-010). Older pairs also sell far less often, so a 100-sale median is a thinner read than a 6,553-sale one.
2. Check your size, because the same shoe is priced by size
A median for "the shoe" mixes every size. In our size curve post we compared each size with the same shoe's typical price across 556,629 GOAT sales (June 30 to September 27, 2026). A men's size 8 sold 3.9% below the same shoe's typical price and a size 12 sold 5.2% above. Size 15 sold 33.2% above.
Those are typical gaps, not a promise for your pair. If your size is common (9 to 11 was half of all pairs), the shoe's overall median is a close guide. If it sits at either end, look for the median in your size.
3. Use sold prices and read the range, not one number
An asking price is what someone hopes for. A sold price is what a buyer paid. Use sold prices, and then look at how far apart they are.
We took every listing with 100 or more sales over the 90 days, across both marketplaces (2,573 listings: 988 on GOAT, 1,585 on StockX). For each one we measured the width of the middle half of its sales (the 25th to the 75th percentile) as a share of its median price.
For the typical shoe, the middle half of sold prices spans 23% of the median.
Half of the shoes sit between 17% and 32%. On a shoe with a $200 median, 23% is about $47: roughly a $177 to $223 band around the middle, with the other half of sales outside it. This is the honest "it depends" number. If someone tells you your pair is worth exactly $200, they are giving you the middle of a band that wide.
4. A worn pair is not the same as a new one
GOAT sells used pairs as well as new ones. StockX sells new pairs only. Our data records the sale price and the size but not the condition, so it cannot separate a worn pair from a deadstock one.
What that means for you: the medians above blend whatever mix of conditions sold. Treat them as the market for the shoe. A worn pair may not fetch the same as a new one, and we cannot say by how much, so we will not guess a discount.
5. Compare marketplaces before you decide where to sell
The same shoe does not sell for the same median everywhere. We matched 2,082 shoes by style code that had 30 or more sales on both GOAT and StockX in the same 90 days.
| Which median was higher | Shoes | Share |
|---|---|---|
| GOAT | 1,213 | 58.3% |
| StockX | 819 | 39.3% |
| Exactly equal | 50 | 2.4% |
The typical gap was small: StockX's median was 2.3% below GOAT's, and the typical shoe differed by 6.8% either way. Excluding ties, StockX was higher on 40.3% of shoes (interval 38.2% to 42.5%, exact sign test p < 0.001). Remember that GOAT's mix includes used pairs and StockX's does not, so the gap is not purely a price gap.
Sold price is only the start. After fees you keep a different amount on each platform, so run your number through the resale fee calculator and the StockX or GOAT tool.
Put it together
Find the style code, search the exact release, read the median in your size, and keep the 23% band in mind. Our sneaker price checker does that in one step: it gives the median sold price and the typical range from real GOAT and StockX sales. For a model overview, start at a model page such as Air Jordan 1.
How we measured this
Methodology: completed GOAT and StockX sales recorded by SneakerPulse, footwear only, cleats excluded, sales between $0 and $30,000, whole UTC days July 6 to October 3, 2026 (90 days; StockX's source gap of May 22 to July 3, 2026 is outside the window). Step 1 compares StockX listings of the same colorway by release year, each with 100+ sales in the window. Step 2 cites our September 28, 2026 size curve post (GOAT, June 30 to September 27, 2026). Step 3 uses 2,573 listings with 100+ sales, GOAT and StockX counted separately, so a shoe on both appears twice; the spread is (p75 minus p25) divided by the median per listing, then the median and quartiles across listings; medians by platform were 21.0% (GOAT) and 24.7% (StockX). Step 5 matches listings by style code, with 30+ sales on each platform, using the listing with more sales if a code has several; the comparison is of medians, with an exact binomial sign test and a Wilson interval on the 2,032 non-tied shoes; one test is reported, so no multiple-testing correction applies. Sales cluster around releases and restocks, so the interval is somewhat optimistic. StockX sells new pairs only; GOAT also sells used pairs, and condition is not recorded.