Has the sneaker resale market imploded? The same shoes went from 7% up to 7% down
Not an implosion, a turn. Until April 2026 sneakers resold for about 5-7% more than the same pairs a year earlier. That flipped in May, and in September the same shoes sold for 6.7% less.
"The sneaker market has imploded. The luxury watch market is next." That was the headline of a Reddit thread on r/watchHotTakes in late September. The watch half drew most of the arguments. The sneaker half was mostly taken as given.


We don't track watches, so we can't say anything about Rolex. We can check the sneaker half. We compared resale prices for each shoe with that same shoe's prices a year earlier, month by month, across GOAT and StockX.
The answer: sneaker resale prices are falling, but they haven't imploded, and the fall is recent. From October 2025 to April 2026, the same shoes sold for 5-7% more than a year earlier, every single month. In May that started to slip. By September the same shoes sold for 6.7% less than in September 2025.
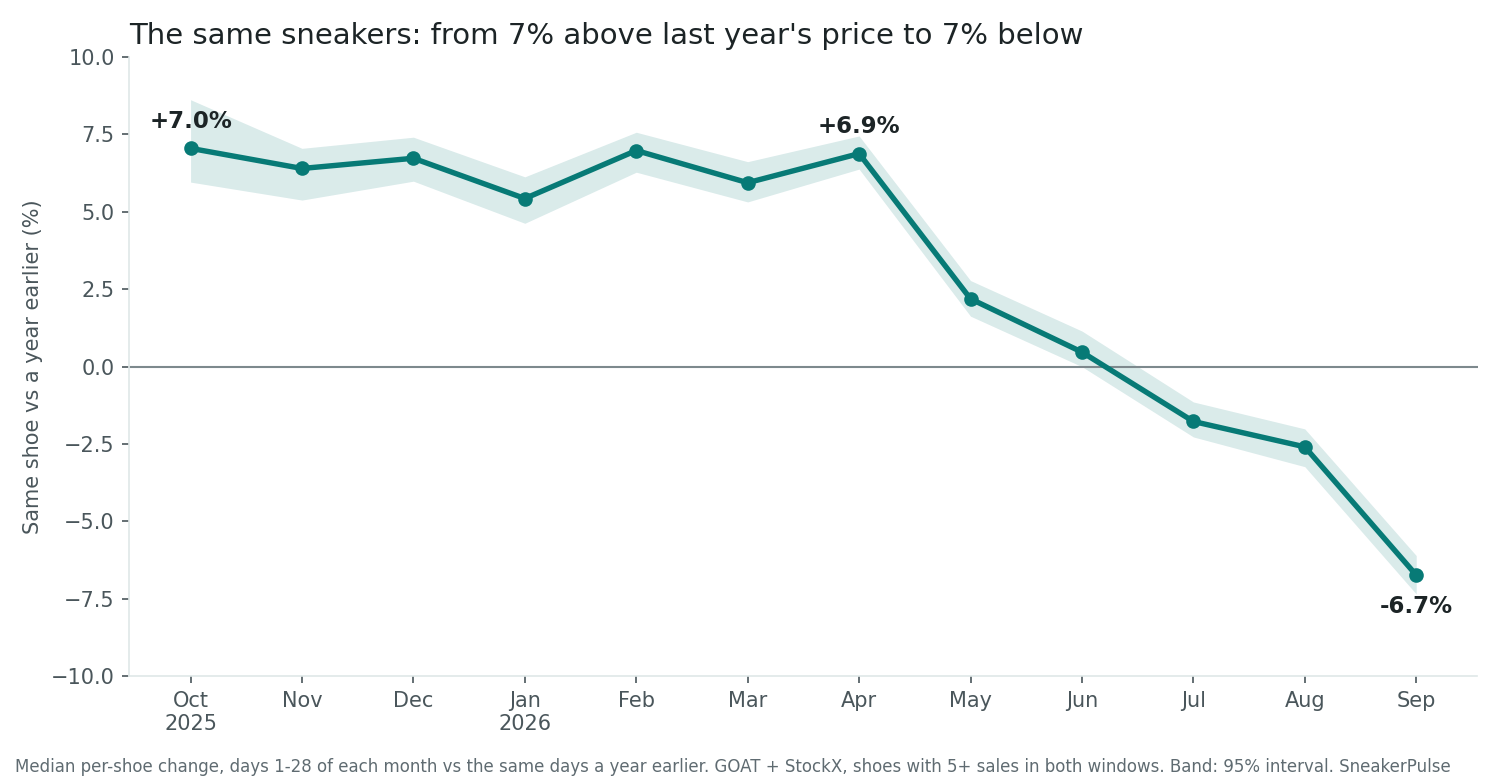
It turned in May
Each point in the chart compares a few thousand shoes with themselves: between 2,159 (October 2025) and 11,107 (May 2026). A month of cheap slides can't fake a crash here, and a month of big Jordan drops can't fake a boom.
Seven months in a row the answer was the same: about 5-7% higher than a year before, with more shoes rising than falling. Then it bent. In May the gain shrank to 2.2%. June was flat (+0.5%; the split between shoes that rose and fell was not clearly different from 50/50). From July every month was below the year before, and September's drop was the steepest yet: 4,291 shoes fell and 2,545 rose.
Through April, the same sneakers resold for more than a year earlier. Since July they have sold for less, and the gap has widened every month.
A 6.7% drop is real. It is not an implosion. A pair that resold for $150 last September went for about $140 this September.
Every kind of shoe turned at the same time
If this were only hyped grails deflating, the cheap shoes would have held. They didn't.
| Same shoe vs a year earlier | April 2026 | September 2026 | Swing |
|---|---|---|---|
| All shoes | +6.9% | -6.7% | -13.6 pts |
| Sold under $100 a year earlier | +14.7% | 0.0% | -14.7 pts |
| $100 to $200 | +6.6% | -7.8% | -14.4 pts |
| $200 and up | -1.6% | -10.4% | -8.8 pts |
| Nike | +10.1% | -4.3% | -14.4 pts |
| Air Jordan | +3.0% | -9.3% | -12.2 pts |
Read the swing column, not the levels. Shoes are put in a price tier by what they sold for a year earlier, so a shoe that happened to sell cheap then tends to drift back up and one that sold dear tends to drift back down. That tilts the cheap tier's level up and the $200-and-up tier's level down, which is why the top tier reads below zero even in April. Every tier swung the same way, by 9 to 15 points.
"Nike killed the scarcity"? Only part of it fits
The thread's most common explanation was that Nike flooded the market and nothing is rare anymore. Part of the data fits. Air Jordan is down 9.3% on a year ago, and it turned first: the same Jordans sold for less than a year earlier from May, two months before shoes as a whole. In our study of 3,770 releases, only one Jordan release in three resold above retail.
Two things don't fit. First, it isn't a Nike story. In September's Resale Index, New Balance (-10.3%) and ASICS (-9.3%) fell as much as Jordan. Two of the most-hyped runners fell far more than their brand averages. On StockX, New Balance 9060 Triple Black went from $144 to $98 between Septembers (-32%), and the ASICS Gel-1130 Black Pure Silver from $143 to $100 (-30%). Meanwhile the plainest shoe there is, the white Air Force 1 '07, barely moved on StockX: $84 to $82.
Second, through 2025 Nike went the other way. The share of new Nike releases that resold above retail on StockX in their first 90 days rose from 37.6% (released October 2024 to June 2025) to 51.7% (July to December 2025). Whatever turned in May 2026 happened after that.
We checked two ways the turn could be fake
One marketplace. StockX has a hole in its data from late May to early July 2026, right where the turn starts. The turn shows on both marketplaces anyway. StockX went from +7.6% in April to -8.2% in September (7,259 and 4,272 shoes). GOAT went from +5.4% to -4.0% (3,323 and 2,641 shoes), after sitting at about zero in July and August.
Release-week hype. Some of September 2025's busiest shoes had only just come out. New shoes usually cool off after their first weeks. So we re-ran the comparison using only shoes that had already been selling for 5+ months a year earlier. Same shape: +9.5% in April, -6.0% in September.
What it means
For buyers, most shoes cost less than they did a year ago. In September, 63% of shoes that moved were cheaper. For anyone who bought a pair last year to hold, the typical pair now resells for less. These are past prices, not a forecast. The data shows when the turn happened, not why, and it says nothing about where prices go next.
We update the Resale Index every month, so you can watch whether the slide keeps going. To see what your exact pair and size is doing, try the price checker.
How we measured this
Methodology: completed resale sales recorded on GOAT and StockX, footwear only. For each month from October 2025 to September 2026 we took days 1-28 and compared them with the same days a year earlier (our data starts in October 2024, so October 2025 is the first month with a year-earlier window). A shoe is one marketplace listing and counts when it has 5 or more sales in both windows. Each month's figure is the median of the per-shoe log price changes with a seeded bootstrap 95% interval. Rose vs fell uses exact sign tests: every month is significant after Benjamini-Hochberg correction across the 12 months (q < 0.001) except June 2026 (p = 0.08). The September figure here (-6.7%, days 1-28) differs slightly from the published September Resale Index (-7.0%, days 1-29). Price tiers use the shoe's year-earlier median. Tier and brand rows in the table are descriptive and not tested; the sign tests and BH correction cover the all-shoes series only, and the under-$100 September figure (0.0%) is not distinguishable from zero. Robustness: the same comparison split by marketplace, and restricted to shoes whose first recorded sale was 150+ days before the year-earlier window (April to September 2026 only, because data starts October 2024). StockX has a source gap from 2026-05-22 to 2026-07-03, which lowers sale counts but not the per-shoe comparison. Individual shoe prices are September 1-28 medians of the StockX listings named. Brand figures in the Nike-releases paragraph come from our 2026-09-24 study of 3,770 releases. Scripts and outputs: tools/blog_charts/2026-10-06-market-imploded.py and .json (series, settled-shoe check, platform split, single shoes).
Keep reading
 Sneaker resale prices in September 2026 - the same shoes sold for 7% less than a year agoOctober 4, 2026 — 4 min read
 The best-selling sneakers on StockX right now (September 2026)September 28, 2026 — 7 min read
 What sneakers does New York City buy? The Air Max 95 is still its shoeOctober 2, 2026 — 5 min read