When do Jordans go down in price after release? Week by week, from 201 launches
Twelve weeks after launch week, the median Air Jordan 4 and Jordan 3 release sold 17% under it. The market sold 7% under. Corrected November 2 and restated November 4. The Jordan 1 and 5 fell about as fast as everything else.
Corrected November 2, 2026, after this post went out the same day. It measured every shoe from its first week with 20+ sales, and that week is often a handful of pre-release pairs at high prices, weeks before the real drop. Measured from launch week, which we now define as the busiest week within eight weeks of that first week, the falls are shallower, for most models about half as deep. Restated November 4: every figure below this note now uses launch week; the old count appears only in this table.
| Model | Releases at week 12 | From the first 20-sale week | From launch week | Against the market, from launch week |
|---|---|---|---|---|
| Air Jordan 4 | 23 | -41% | -17% | clearly behind |
| Air Jordan 3 | 23 | -38% | -17% | clearly behind |
| Air Jordan 6 | 8 | -37% | -24% | too few for the test |
| Air Jordan 11 | 11 | -26% | -21% | in line |
| Air Jordan 5 | 13 | -22% | -12% | in line |
| Air Jordan 1 | 87 | -16% | -9% | in line |
| All models | 760 | -16% | -7% |
So most of the steep early fall we first reported was the pre-release premium going away once the shoe actually dropped. Past sales as recorded November 4, not a forecast.
This week's headlines noticed that the new Air Jordan 5 'Wings' was already selling under retail days after it dropped. People read that as a surprise. In our sales record it is the usual path for a Jordan, and the only real questions are how fast and how far.
So we measured it. For every Air Jordan release since December 2024 with a proper launch week, we took the median completed sale in each week and compared it with that same shoe's launch-week median. Launch week is the shoe's busiest week within eight weeks of its first 20-sale week. One shoe is one style code, GOAT and StockX sales pooled, adult sizes only. That gives 201 Jordan launches across the six models with enough releases to draw a line, and 953 launches across every model we track for comparison.
The answer: most Jordans slide slowly after launch week, and the Jordan 3 and 4 slide faster than the rest. By week 12 the median Air Jordan 6 release sold 24% under its launch week, the Jordan 11 21%, the Jordan 4 and Jordan 3 17%, the Jordan 5 12% and the Jordan 1 9%. The market line, every model pooled, sat at 7%. The big early drops people remember mostly come before launch week, while a few pre-release pairs sell at high prices.
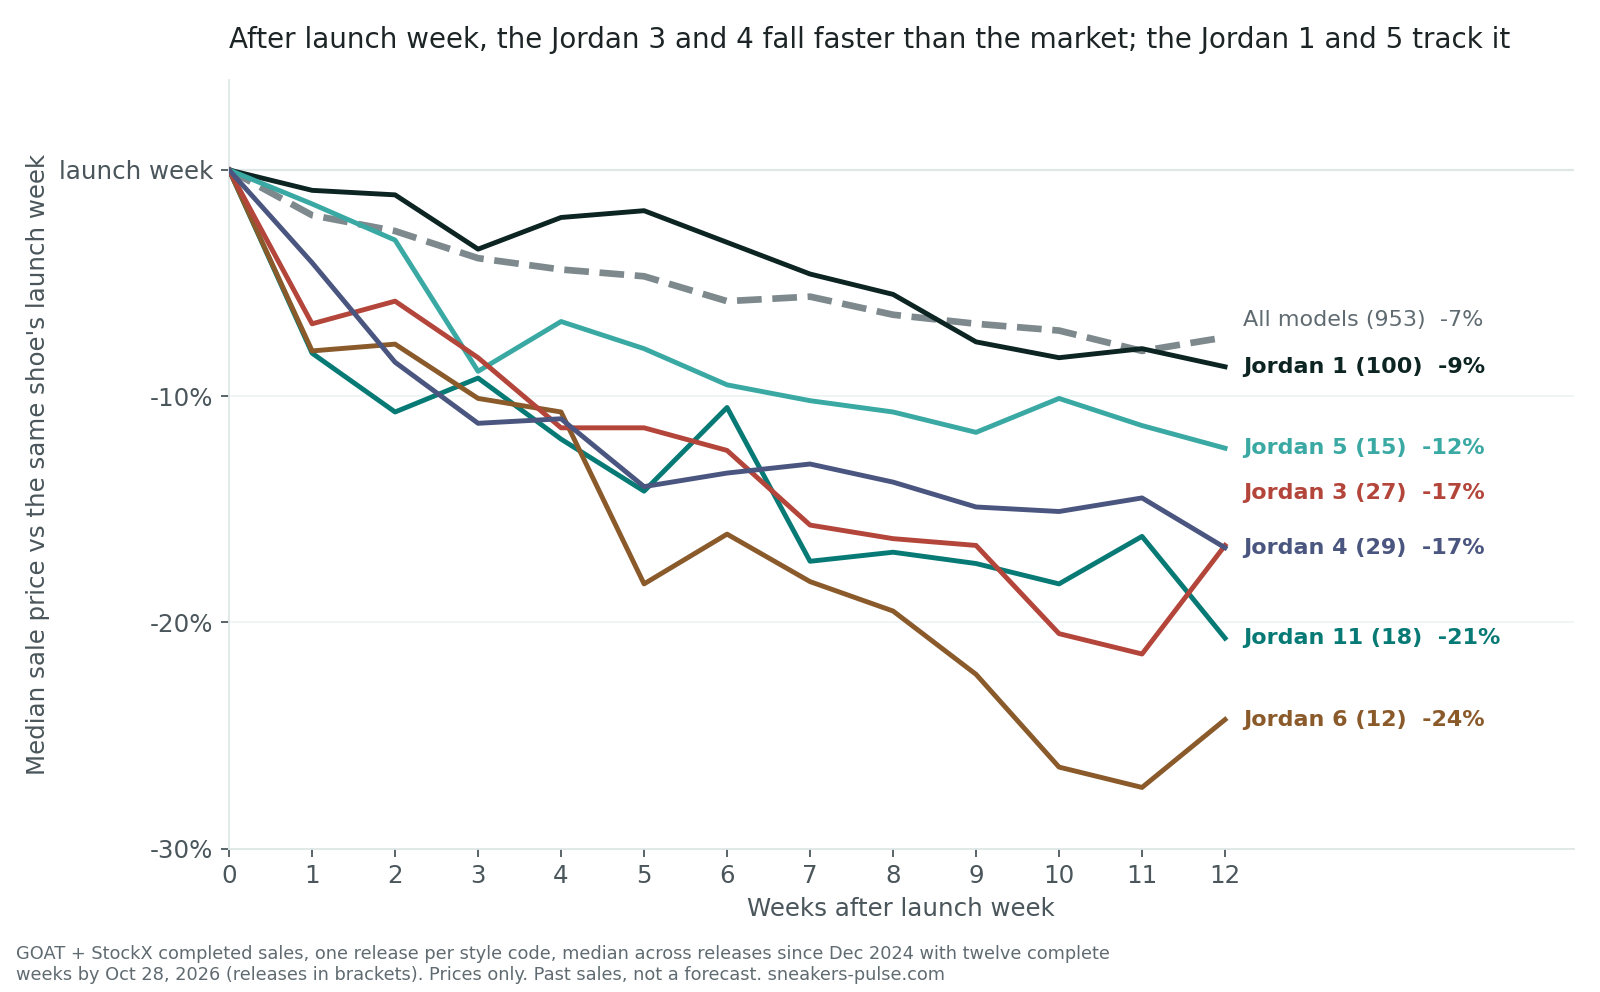
Week by week: the Jordan 3 and 4 clearly fall faster than the market, the 1 tracks it
| Model | Releases | Week 1 | Week 2 | Week 4 | Week 12 | Gap to the market at week 12 |
|---|---|---|---|---|---|---|
| Air Jordan 4 | 29 | -4% | -9% | -11% | -17% | 10 points behind |
| Air Jordan 3 | 27 | -7% | -6% | -11% | -17% | 9 points behind |
| Air Jordan 6 | 12 | -8% | -8% | -11% | -24% | too few at week 12 for the test |
| Air Jordan 11 | 18 | -8% | -11% | -12% | -21% | 13 points behind, not significant after correction |
| Air Jordan 5 | 15 | -2% | -3% | -7% | -12% | 5 points behind (-14 to 16), in line |
| Air Jordan 1 | 100 | -1% | -1% | -2% | -9% | 1 point behind (-3 to 4), in line |
| All models | 953 | -2% | -3% | -4% | -7% |
The gap column compares each model's releases with every other model's releases at week 12. Only the Jordan 3 and Jordan 4 fall clearly faster than the market. The Jordan 11 looks like it does, but with 11 releases reaching week 12 the result does not survive the correction, so we call it in line. The Jordan 1, with 100 launches, moves with the market: it fell 9%, the market fell 7%.
On the typical Jordan 4 or Jordan 3 release, a buyer who waited two weeks after launch week paid 6% to 9% less. Waiting twelve weeks, about 17% less.
What that looks like on this autumn's releases
The curves are medians across many shoes. Individual releases move in bigger steps, and the steepest step often comes before launch week, when pre-release pairs are the only ones selling.
Air Jordan 5 'Halloween' (retail $220, launch week of October 12). Its first 20-sale week, September 21, had a $350 median on 71 sales, mostly pre-release pairs. Launch week was $216 on 2,991 sales, already under retail. The next week was $195 on 2,464 sales, 10% under launch week and 11% under retail. Most of the fall from $350 happened before the shoe's busiest week.
Air Jordan 5 'Black University Blue' 2026 (retail $220, launch week of August 17). The opposite shape: $260 on 1,859 sales in launch week, still $249 at week 3, then $233, $227, $220 and $218, reaching $215 by week 9 (17% under launch week, 2% under retail, 8,723 sales over those ten weeks). Same model, same retail, two different paths. Jordan 5 releases disagree with each other more than the median suggests.
Women's Air Jordan 4 'Forget Me Not' (retail $200, launch week of April 28, 2025). Its first 20-sale week was $320 on 45 pre-release sales. Launch week was $192 on 4,556 sales, already under retail. It fell to $152 by week 4, then came back to $178 at week 12, 7% under launch week and 11% under retail, on 17,560 sales. Same-shoe prices can rise again; the median line hides that.
Air Jordan 1 Low SE 'Olive Grey' (retail $130, launch week of February 16). $97 on 34 sales in launch week, 25% under retail from the start, then $93 to $97 through week 8, $87 for weeks 9 to 11 and $82 at week 12 (31 sales), on 337 sales in all. Many general-release Jordan 1s never trade above retail, so there is no launch premium (the amount a shoe sells above retail in its first weeks) to lose. That is one reason the Jordan 1 line is gentle.
Under launch week is not the same as under retail
A 17% fall from launch week only matters to a buyer if launch week was above retail. Our Sunday ranking measures the other thing: the median sale 12 weeks after the first week with 20+ sales against the shoe's retail price. On the ranking published yesterday (releases with that week complete by October 28, as recorded November 1), the median Jordan 5 release sat 1% under retail (14 releases, around retail), the Jordan 11 10% under (11 releases), the Jordan 4 18% under (23), the Jordan 6 26% under (8), the Jordan 1 26% under (88 releases, interval -30% to -16%, clearly below the rest, q < 0.001) and the Jordan 3 27% under. Across all 736 releases in the ranking, the median shoe sold 5% under retail that week and 45% of releases sold at or above it. The ranking moves to the launch-week count with its November 8 issue.
Put the two together and the Jordan 1 is the clearest case: it falls about as fast as the market after launch week, but it starts low, because most of its 88 releases were general releases that opened near or under retail. The Jordan 3 and 4 fall faster and end well under retail. The Jordan 5 ended near retail, and its releases split.
How to use this if you are waiting on a pair
- Name the model first. The Jordan 3, 4, 6 and 11 fell more after launch week than the 1 or 5 in the past two years, though only the 3 and 4 clear the market test; the model page's "Twelve weeks in" row shows the model's own curve against the market, with how many releases it rests on: Air Jordan 4, Air Jordan 3, Air Jordan 5.
- Do not pay the pre-release price. The steepest falls in this post came before launch week, from a few early pairs at high prices. After launch week, the market line moved 3% by week 2 and 7% by week 12.
- Check retail, not just the launch price. A shoe that opened at retail has little room to fall. The Sunday ranking lists which models' releases sat above or below retail at week 12, and the best time to sell tool draws any model's curve.
- Mind the sample. A median on 45 or 71 sales is a pre-release price paid by a few people; the launch-week median on 2,991 sales is the market.
None of this says what the next release will do. These are the paths that 201 past Jordan launches took, and individual shoes, the 'Black University Blue' included, left the path.
The tests behind these numbers
The paragraphs and tables above, in full, with their intervals and tests.
The gap column compares each model's releases with every other model's releases at week 12 (a Mann-Whitney test with a bootstrap interval, corrected across all the models we test at once). Only the Jordan 3 and Jordan 4 fall clearly faster than the market. The Jordan 11 looks like it does, but with 11 releases reaching week 12 the result does not survive the correction, so we call it in line. The Jordan 1, with 100 launches, moves with the market: it fell 9%, the market fell 7%. (q is the p-value after correcting for the number of models tested at once; under 0.05 counts as clear.)
A 17% fall from launch week only matters to a buyer if launch week was above retail. Our Sunday ranking measures the other thing: the median sale 12 weeks after the first week with 20+ sales against the shoe's retail price. On the ranking published yesterday (releases with that week complete by October 28, as recorded November 1), the median Jordan 5 release sat 1% under retail (14 releases, around retail), the Jordan 11 10% under (11 releases), the Jordan 4 18% under (23), the Jordan 6 26% under (8), the Jordan 1 26% under (88 releases, interval -30% to -16%, clearly below the rest, q < 0.001) and the Jordan 3 27% under (23, interval -34% to -13%, q 0.009). Across all 736 releases in the ranking, the median shoe sold 5% under retail that week and 45% of releases sold at or above it. The ranking moves to the launch-week count with its November 8 issue.
| Model | Releases at week 12 | From the first 20-sale week | From launch week | Against the market, from launch week |
|---|---|---|---|---|
| Air Jordan 4 | 23 | -41% | -17% | clearly behind (q 0.03) |
| Air Jordan 3 | 23 | -38% | -17% | clearly behind (q 0.005) |
| Air Jordan 6 | 8 | -37% | -24% | too few for the test |
| Air Jordan 11 | 11 | -26% | -21% | in line (q 0.054, not called) |
| Air Jordan 5 | 13 | -22% | -12% | in line |
| Air Jordan 1 | 87 | -16% | -9% | in line |
| All models | 760 | -16% | -7% |
| Model | Releases | Week 1 | Week 2 | Week 4 | Week 12 | Gap to the market at week 12 |
|---|---|---|---|---|---|---|
| Air Jordan 4 | 29 | -4% | -9% | -11% | -17% | 10 points behind (95% interval 6 to 16, q 0.03) |
| Air Jordan 3 | 27 | -7% | -6% | -11% | -17% | 9 points behind (3 to 23, q 0.005) |
| Air Jordan 6 | 12 | -8% | -8% | -11% | -24% | too few at week 12 for the test |
| Air Jordan 11 | 18 | -8% | -11% | -12% | -21% | 13 points behind, not significant after correction (3 to 18, q 0.054) |
| Air Jordan 5 | 15 | -2% | -3% | -7% | -12% | 5 points behind (-14 to 16), in line |
| Air Jordan 1 | 100 | -1% | -1% | -2% | -9% | 1 point behind (-3 to 4), in line |
| All models | 953 | -2% | -3% | -4% | -7% |
How we measured this
Methodology: GOAT and StockX completed sales, adult footwear, one release per style code with both marketplaces' listings merged, no cleats. A release's launch week is its busiest week within eight weeks of its first week with 20 or more sales (earliest on a tie), and every "week N" here counts from it; releases from December 2024 whose twelfth week ended on or before October 28, 2026, the last day both marketplaces are fully loaded on the backfill gate. Each week's figure is the median completed sale that week divided by the same release's launch-week median; the model line is the median across its releases (data/sell_timing.json, refreshed November 4, 2026). "Gap to the market" is the median difference at week 12 between the model's releases and every other tracked model's releases, Mann-Whitney test, 95% bootstrap interval over releases, Benjamini-Hochberg q-values across all models tested; the Jordan 6 and 12 have too few releases reaching week 12 for the test. Week-12-versus-retail figures come from the November 1 Sunday ranking (StockX retail catalog fetched October 31; 736 releases). The four named shoes use the same launch rule on their own pooled sales through October 28 (full weeks only), with children's sizes excluded; weekly medians are quoted with their sale counts. StockX prices are the US view. Prices only, no volume trend. Past sales, not a forecast.
The shoes in this post
The 11 shoes named above, each with its own page: recorded sales by size and marketplace, updated daily. Photos GOAT and StockX.
 Air Jordan 5 Retro 'Halloween'Check the price →
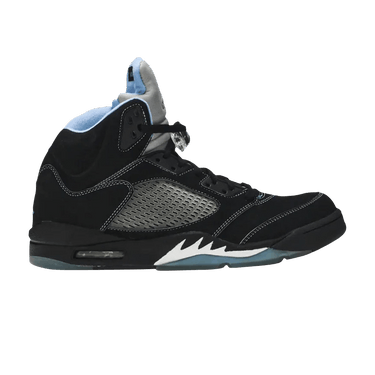 Air Jordan 5 Retro 'Black Carolina / UNC' 2026Check the price →
 Wmns Air Jordan 4 Retro 'Forget Me Not'Price by colorway →
 Air Jordan 6 Retro 'Cap and Gown'Check the price →
 Jordan 1 Low SE Olive GreyCheck the price →
 Air Jordan 4Model page →
 Air Jordan 3Model page →
 Air Jordan 6Model page →
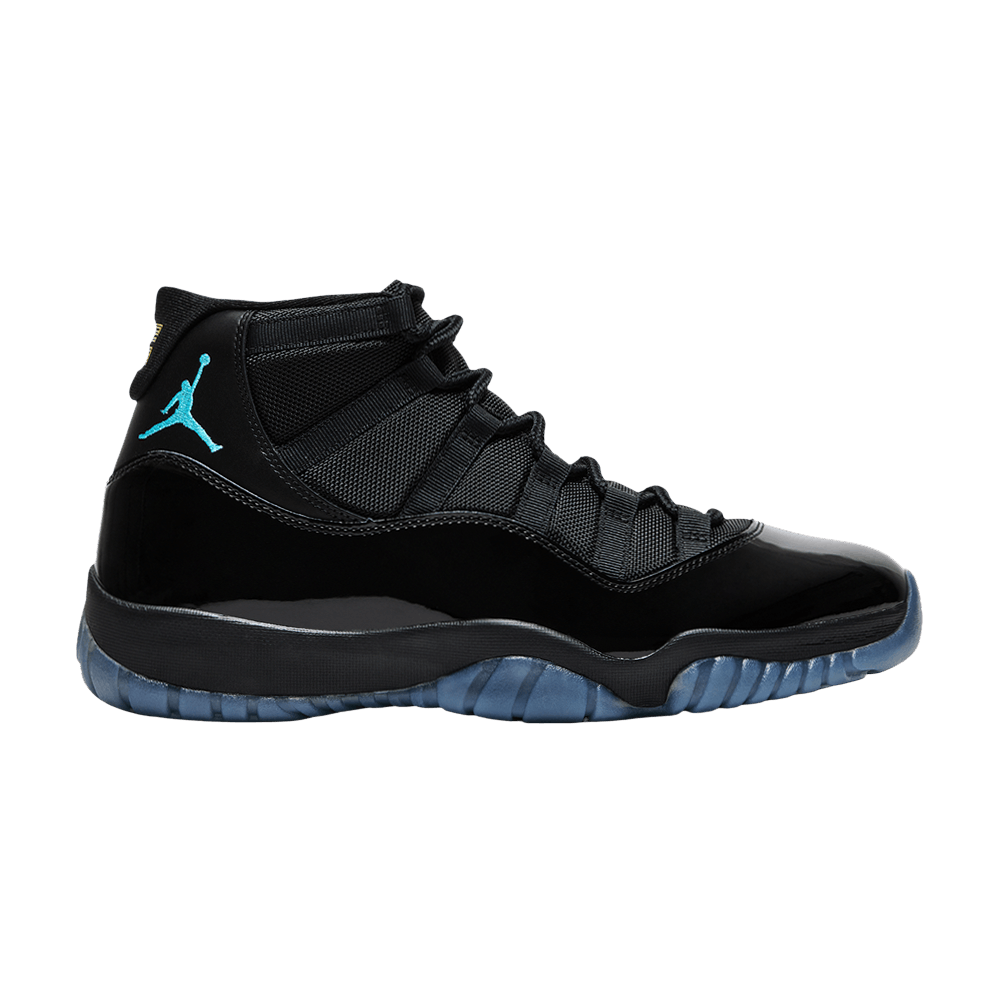 Air Jordan 11Model page →
 Air Jordan 5Model page →
 Air Jordan 1Model page →