Fall sneaker trends 2026, what sells more when summer ends, two years of resale data
Boots, shearling, Gore-Tex and marathon racers rose in both Septembers we have data for. Here is what else moves when summer ends.
Every September, what people buy on the resale market changes. We measured it two ways. First, each model's share of all footwear resale sales in summer (June to August) against early fall (September 1-21), in both 2025 and 2026. Second, the whole of fall 2025 (September to November). We use share rather than raw counts because the number of sales we record moves month to month. A model only counts as a mover if the change passes a significance test against the market-wide shift, corrected for testing hundreds of models at once.
The short version: boots, shearling and weatherproof trail shoes gain every fall, marathon racers do too, and summer's low-profile terrace shoes and Dunks fade.
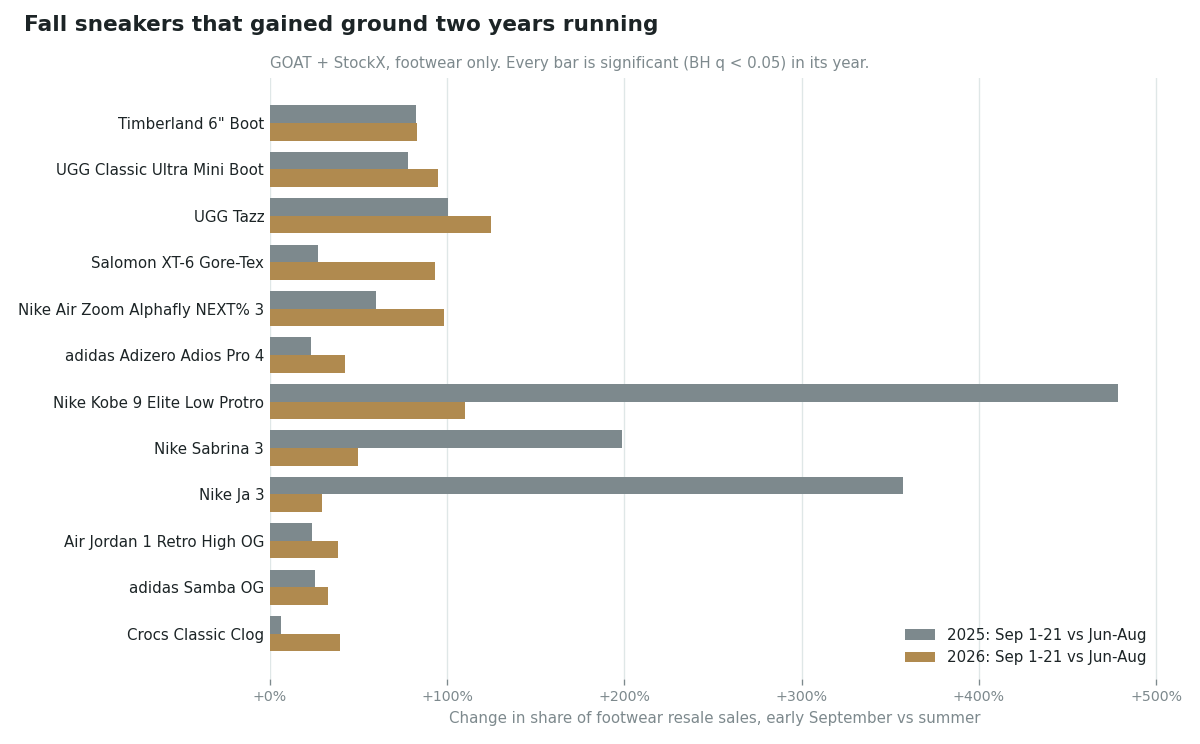
What rose in early fall both years
| Model | Sep 2025 vs summer | Sep 2026 vs summer | Sep 1-21, 2026 sales |
|---|---|---|---|
| UGG Tazz | +100% | +125% | 120 |
| Nike Kobe 9 Elite Low Protro | +478% | +110% | 501 |
| Nike Air Zoom Alphafly NEXT% 3 | +60% | +98% | 558 |
| UGG Classic Ultra Mini Boot | +78% | +95% | 432 |
| Salomon XT-6 Gore-Tex | +27% | +93% | 580 |
| Timberland 6" Boot | +83% | +83% | 547 |
| Nike Sabrina 3 | +199% | +50% | 457 |
| adidas Adizero Adios Pro 4 | +23% | +43% | 252 |
| Crocs Classic Clog | +6% | +39% | 2,451 |
| Air Jordan 1 Retro High OG | +24% | +39% | 4,047 |
| adidas Samba OG | +26% | +33% | 3,122 |
| Nike Ja 3 | +357% | +29% | 2,245 |
Change in the model's share of footwear resale sales, September 1-21 against June-August of the same year. All significant at q < 0.05 in both years.
These fall into four groups:
- Cold-weather boots and shearling. The Timberland 6" boot gained 83% both years, almost exactly. The UGG Tazz and Classic Ultra Mini rose by roughly 80-125%. Timberland's waterproof premium version went from 0.26% to 0.59% of all footwear sales this September. For how far UGG demand climbs after September, see when UGGs sell the most.
- Weatherproof trail shoes. The Gore-Tex Salomon XT-6 rose both years, much more this year (+93%).
- Marathon racers. Nike's Alphafly 3 and adidas' Adios Pro 4 gained both years. That lines up with the big autumn marathons, though the data cannot show the cause.
- Basketball. Kobe, Sabrina and Ja signature shoes gained both Septembers. These lines add new colorways often, so part of the 2025 jumps (+478% for the Kobe 9 Elite Low Protro, +357% for the Ja 3) may be release timing rather than season. Our data cannot separate the two.
Does fall repeat? Partly
Across the 266 models with enough sales in both years, the early-fall change in 2025 and the early-fall change in 2026 were correlated at r = 0.42 (95% interval 0.32-0.52, p < 0.0001). 165 of the 266 (62%, interval 56-68%) moved in the same direction both years, more than chance would give (binomial p = 0.0001). So there is a real seasonal pattern, but it explains only part of the change. Plenty of September moves are one-offs driven by a release or a trend.
What is fading this September
| Model | Share in summer 2026 | Share Sep 1-21, 2026 |
|---|---|---|
| Nike Dunk | 1.16% | 0.45% |
| adidas Gazelle | 0.19% | 0.05% |
| adidas Campus | 0.13% | 0.05% |
| Air Jordan 13 | 0.13% | 0.05% |
| Maison Mihara Yasuhiro Peterson | 0.32% | 0.13% |
Last year's full fall (September to November 2025) showed the same kind of turnover. The Air Jordan 14 fell from 0.49% to 0.12% of sales, and the Converse Chuck Taylor All Star Hi from 0.11% to 0.03%. Meanwhile the UGG Lowmel rose from 0.04% to 0.24% and the Timberland 6" Boot from 0.05% to 0.17%. Of 662 models tested, 511 changed share significantly between summer and fall 2025.
New this year: the YZY SL-01 more than doubled its share to 1.98% of all footwear sales, and the Nike Mind 001 Slide rose from 0.67% to 1.41%. For what is moving this week, see the trending page.
Do fall shoes get pricier?
Comparing the same shoes' median sale price in summer and fall (products with 10+ sales in both windows):
| Brand | Shoes compared | Fall 2025 vs summer 2025 | Sep 1-21, 2026 vs summer 2026 |
|---|---|---|---|
| UGG | 149 / 55 | +17.4% | +10.5% |
| Salomon | 104 / 37 | +10.3% | -3.7% |
| ASICS | 727 / 150 | +6.4% | +2.0% |
| Nike | 7,701 / 1,822 | +3.9% | 0.0% |
| adidas | 2,604 / 569 | +2.2% | -0.5% |
| Air Jordan | 4,014 / 1,256 | +0.5% | -0.7% |
Only UGG shows a clear fall price rise both years. For most brands, prices barely moved in early September 2026. The 2025 column covers all of fall, the 2026 column only its first three weeks, so the two are not directly comparable. If you are selling, the fee calculator shows your payout, and the best time to sell tool shows how prices typically move after a release. These are patterns in past sales, not predictions.
How we measured this
Methodology: GOAT and StockX resale sales recorded via kicks.dev, footwear only (apparel, accessories and collectibles excluded), sales $10-$5,000. Windows: June 1 - August 31 and September 1-21 of 2025 and 2026, plus September 1 - November 30, 2025. Products are grouped into models by their listed model name, with brand prefixes and punctuation folded so GOAT and StockX names match. A model needs 300+ summer sales to be tested. Each model's fall count is tested with an exact binomial against the market-wide summer/fall split, then Benjamini-Hochberg corrected across all models tested in that comparison (455 in 2025, 305 in 2026, 662 for full fall 2025). Sales cluster around releases, so these tests are somewhat optimistic; the sample floors are there partly for that reason. The year-to-year correlation uses log share changes across the 266 models tested in both years. Our StockX feed was repaired this week, and the last few days of September 2026 may still be slightly under-counted; shares are less sensitive to that than raw counts. Prices compare the same product's medians.