Air Jordan 9 resale prices a year later: the same pairs sell for 7% less
We matched 59 Air Jordan 9 listings to their own sales a year earlier. 38 now sell for less and the typical pair is down 7.1%, while the typical sneaker outside the 9 is down 0.5%. The 2024 'Olive' is the big exception.
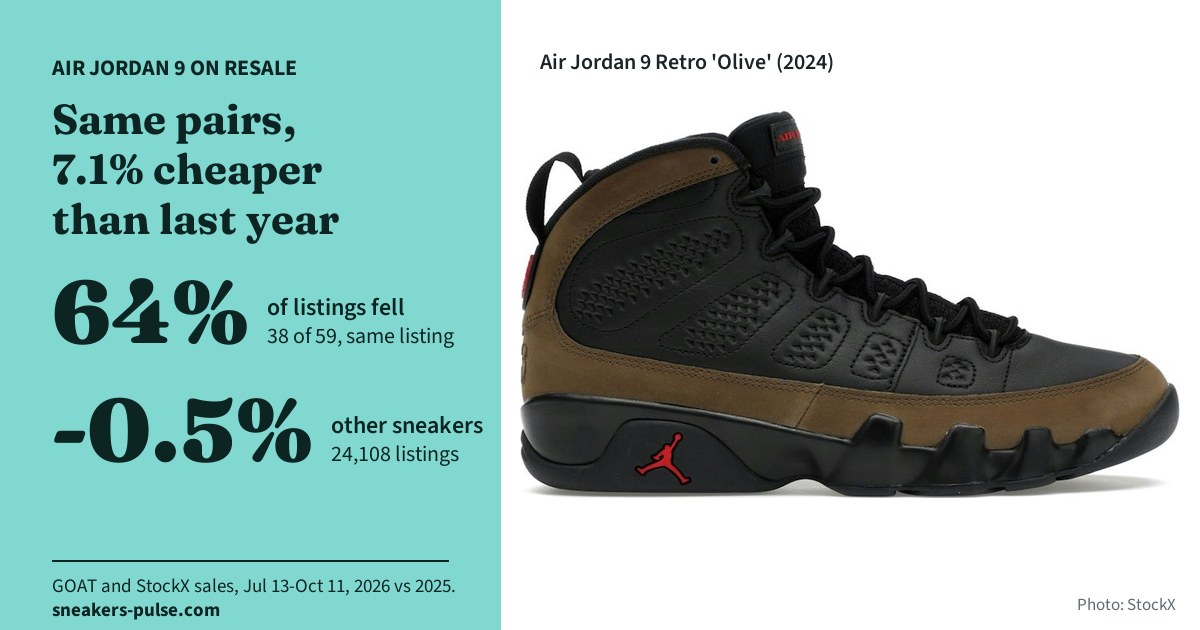
The Air Jordan 9 is back in the release news this week: a 'Charcoal' retro has been announced for fall 2027, and a winter boot version is getting fresh attention. It is a good moment to ask what the 9s already out there have done on resale.


Over the last year, most got cheaper. We took every Air Jordan 9 listing that sold at least five times both from July 13 to October 11, 2025 and over the same dates in 2026, and compared each listing with itself. The typical pair now sells for 7.1% less than it did a year ago, and 38 of 59 listings fell. Over the same dates, the typical sneaker outside the 9 slipped 0.5%.
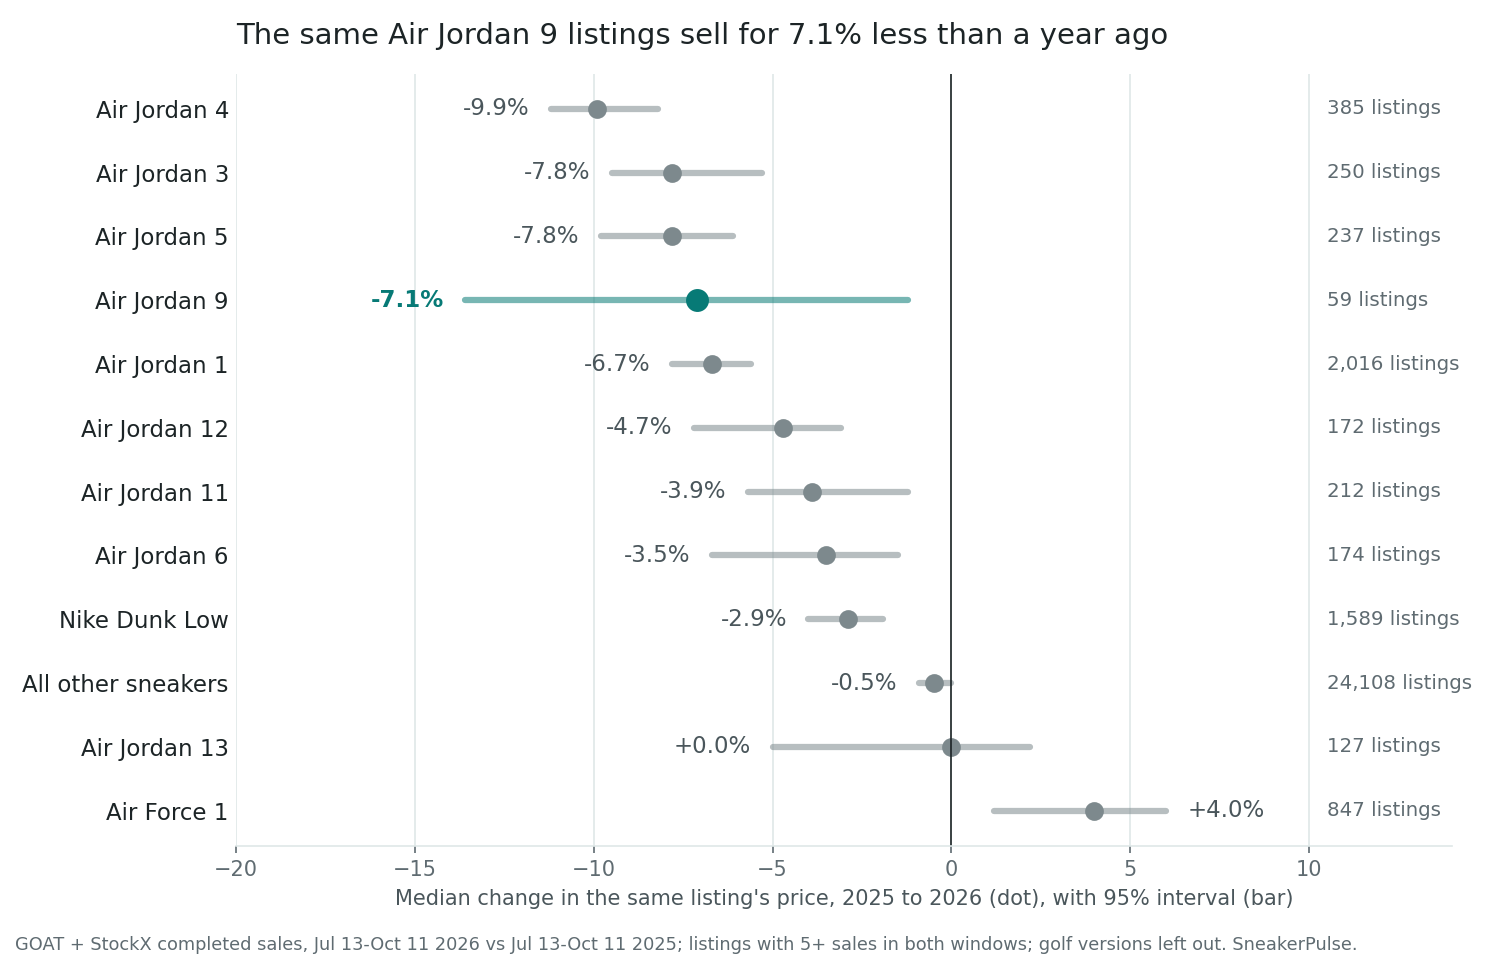
The 9 fell with the other big retros
Comparing each listing with itself matters. One median across all pairs can move just because the mix changed, for example because a cheaper colorway sold more this year. Same-listing changes take that out: a 'Chile Red' is only compared with a 'Chile Red' on the same marketplace.
On that basis the Air Jordan 9's median change is -7.1%, and the 95% interval, the range the true figure most likely sits in, runs from -13.6% to -1.2%. That is further down than the rest of the market at -0.5%, and the gap survives correction for every test behind this post (rank test, q = 0.047).
The 9 is in the same pack as the Air Jordan 1 (-6.7%), 3 (-7.8%) and 5 (-7.8%). Only the 4 fell further, at -9.9%. The 12, 11 and 6 fell less, the 13 was flat, and the Air Force 1 rose 4.0%.
Roughly two in three Air Jordan 9 listings sell for less than a year ago. The 9 has far fewer listings than the 4 or the 1, so its interval is wide.
That width is the honest caveat. With 59 listings, the share that fell (64%) is suggestive on its own but does not pass the multiple-testing bar (q = 0.07). The firm finding is the gap to the rest of the market.
The best sellers split: 'Olive' up, 'Cool Grey' flat
The most-traded 9s did not move together.
| Same listing | Jul-Oct 2025 | Jul-Oct 2026 | Change |
|---|---|---|---|
| 'Cool Grey' 2025, StockX | $226 (943 sales) | $215 (305) | -5% |
| 'Cool Grey' 2025, GOAT | $232 (944) | $236 (206) | +2% |
| 'Olive' 2024, StockX | $185 (524) | $197 (230) | +6% |
| 'Olive' 2024, GOAT | $177 (325) | $214 (148) | +21% |
| 'Powder Blue' 2024, StockX | $150 (217) | $144 (191) | -4% |
| 'Chile Red', StockX | $234 (135) | $220 (153) | -6% |
| Boot NRG 'Black Light Gum', StockX | $187 (133) | $140 (270) | -25% |
| OG 2016 (white / true red), StockX | $375 (51) | $287 (103) | -23% |
The 2024 'Olive' is the clearest riser among the big sellers, up on both marketplaces. The 'Cool Grey', released in early 2025, held within a few percent of where it was last summer.
The newest 9 is not in this comparison because it did not exist a year ago: the 2026 'Space Jam' retro, $215 at retail, has a median of $238 across the 5,788 StockX sales recorded since September 19. Our Space Jam post follows it from launch.
The steepest falls were the boots and the older pairs. The Boot NRG 'Black Light Gum' fell 25% on StockX and 27% on GOAT ('Black Gum', $192 to $140), and the 'Wheat' boot went from $247 to $135 on StockX (24 sales a year ago, 94 this year). Both windows are summer and early autumn, so this is not boots being out of season in one year and in season in the other. Across all six boot listings the median is -26%, but six listings are too few for a firm result.
StockX did most of the falling
StockX listings are down a median 11.5% (37 listings), against -2.1% for the rest of StockX. GOAT listings are down 2.1% (22 listings, interval -11.1% to +5.3%), against +1.5% for the rest of GOAT. The direction is the same on both, but on GOAT the 9's change is not distinguishable from zero.
Kids' listings (GS, PS and BG) are down a median 15.3%, but with 14 listings the interval runs from -26.9% to +8.9%, so the data cannot say kids' pairs fell faster than men's (-7.1%, 43 listings).
What it means if you own a pair, or want one
If you bought a 9 a year ago, the record says a typical pair sells for somewhat less today, and boots and older retros for a quarter less or more. The 'Olive' and the 'Cool Grey' are the exceptions among the big sellers. These are past sales, not a forecast, and not a reason to buy or sell.
To check your own pair, the Air Jordan 9 page has today's median and the band half of pairs sold in, and the price checker breaks any listing down by size. For the model that fell furthest, see Air Jordan 4 resale prices a year later.
How we measured this
Methodology: completed sales on GOAT and StockX recorded by SneakerPulse, July 13 to October 11, 2026 against July 13 to October 11, 2025, sale prices above $0 and under $30,000, accessories and football, soccer and baseball cleats excluded. Air Jordan 9 means listing names matching "Jordan 9" as a whole word (Retro, Low and Boot versions and collaborations). Golf versions are left out of the Air Jordan 9 figures and of the market comparison; for reference, all 10 Air Jordan 9 golf listings fell (median -15.5%). The Air Jordan 9 page counts the golf versions in its own year-on-year line, and its windows end on the latest day loaded, which is why it shows a larger drop (-11.3% across 68 listings when this post was written). Each listing's median sale price in 2026 is divided by its own median in 2025; listings need 5+ sales in both windows (59 Air Jordan 9 listings; 24,108 other sneaker listings). The headline is the median of those ratios, with a 95% interval from 2,000 bootstrap resamples. Rose/fell shares use exact binomial tests; the Air Jordan 9 vs other sneakers comparison uses a Mann-Whitney test. Benjamini-Hochberg correction across the 10 tests behind this post (all, GOAT, StockX, men's, kids', women's, boots, non-boots, golf, vs the market): only the market comparison (q = 0.047) and the golf result (q = 0.02) are below 0.05. Other models use the same method on the same data. StockX sales carry no size, so size mix within a listing is not controlled. Prices only: our record of recent weeks is still loading for some listings, so no change in sales volume is reported, and the sales counts in the table are not a measure of demand.
Keep reading
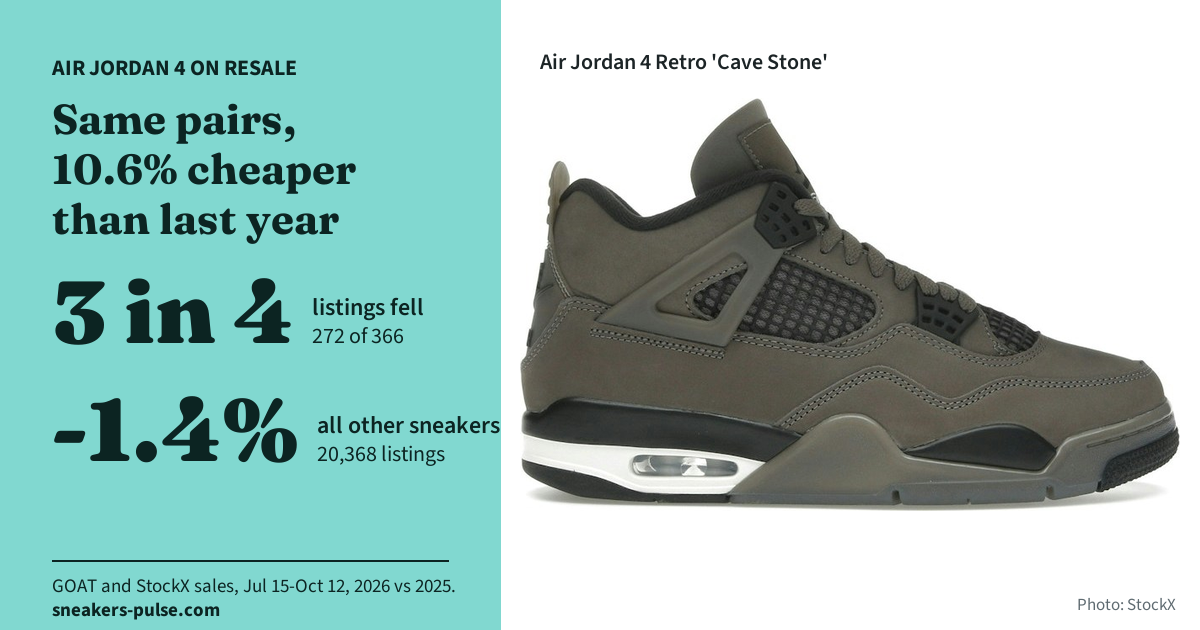 Air Jordan 4 resale prices a year later: the same pairs sell for 10.6% lessOctober 15, 2026 — 5 min read
 Nike Ja 4 'Zombie' resale: last year's Ja 3 Zombie fell below retail, then climbed 17% this OctoberOctober 19, 2026 — 5 min read
 Nike Doernbecher resale prices: last set's Air Max Plus is up 51%, its Jordan down 24%October 17, 2026 — 5 min read